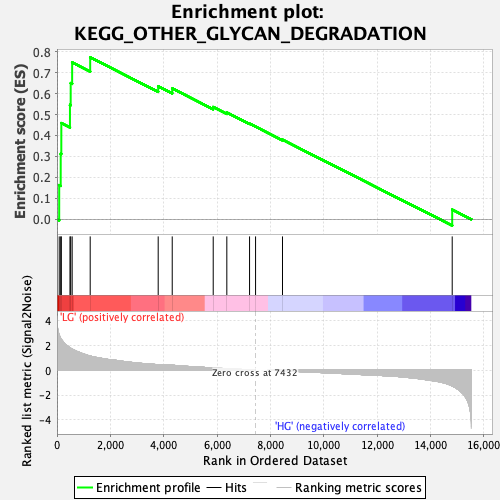
Profile of the Running ES Score & Positions of GeneSet Members on the Rank Ordered List
| Dataset | preliminary.phenotype.cls#LG_versus_HG.phenotype.cls#LG_versus_HG_repos |
| Phenotype | phenotype.cls#LG_versus_HG_repos |
| Upregulated in class | LG |
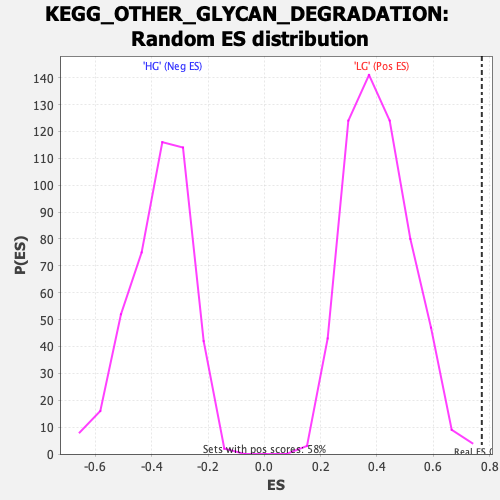
| GeneSet | KEGG_OTHER_GLYCAN_DEGRADATION |
| Enrichment Score (ES) | 0.7725404 |
| Normalized Enrichment Score (NES) | 1.906433 |
| Nominal p-value | 0.0017391305 |
| FDR q-value | 0.0075706397 |
| FWER p-Value | 0.016 |
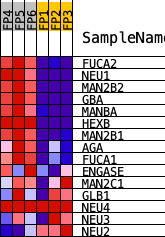
| PROBE | DESCRIPTION (from dataset) | GENE SYMBOL | GENE_TITLE | RANK IN GENE LIST | RANK METRIC SCORE | RUNNING ES | CORE ENRICHMENT | |
|---|---|---|---|---|---|---|---|---|
| 1 | FUCA2 | Fuca2 | 83 | 2.798 | 0.1629 | Yes | ||
| 2 | NEU1 | Neu1 | 139 | 2.549 | 0.3127 | Yes | ||
| 3 | MAN2B2 | Man2b2 | 162 | 2.456 | 0.4590 | Yes | ||
| 4 | GBA | Gba | 486 | 1.793 | 0.5460 | Yes | ||
| 5 | MANBA | Manba | 513 | 1.755 | 0.6498 | Yes | ||
| 6 | HEXB | Hexb | 568 | 1.696 | 0.7483 | Yes | ||
| 7 | MAN2B1 | Man2b1 | 1244 | 1.126 | 0.7725 | Yes | ||
| 8 | AGA | Aga | 3792 | 0.435 | 0.6345 | No | ||
| 9 | FUCA1 | Fuca1 | 4318 | 0.392 | 0.6242 | No | ||
| 10 | ENGASE | Engase | 5854 | 0.174 | 0.5357 | No | ||
| 11 | MAN2C1 | Man2c1 | 6364 | 0.116 | 0.5099 | No | ||
| 12 | GLB1 | Glb1 | 7216 | 0.021 | 0.4563 | No | ||
| 13 | NEU4 | Neu4 | 7441 | 0.000 | 0.4419 | No | ||
| 14 | NEU3 | Neu3 | 8450 | -0.049 | 0.3798 | No | ||
| 15 | NEU2 | Neu2 | 14810 | -1.268 | 0.0461 | No |