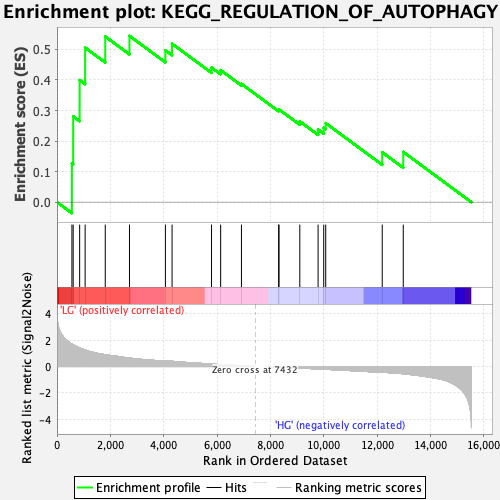
Profile of the Running ES Score & Positions of GeneSet Members on the Rank Ordered List
| Dataset | preliminary.phenotype.cls#LG_versus_HG.phenotype.cls#LG_versus_HG_repos |
| Phenotype | phenotype.cls#LG_versus_HG_repos |
| Upregulated in class | LG |
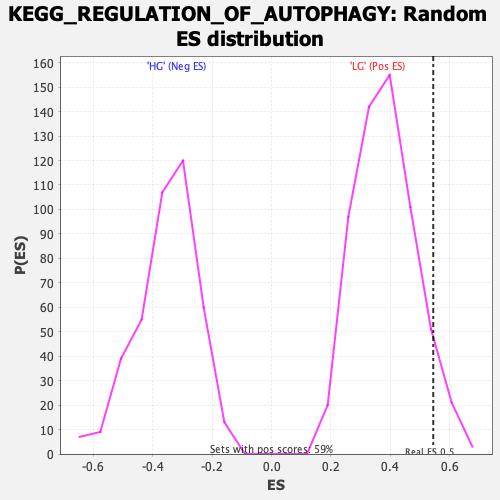
| GeneSet | KEGG_REGULATION_OF_AUTOPHAGY |
| Enrichment Score (ES) | 0.54430276 |
| Normalized Enrichment Score (NES) | 1.4137889 |
| Nominal p-value | 0.076271184 |
| FDR q-value | 0.28219417 |
| FWER p-Value | 0.994 |
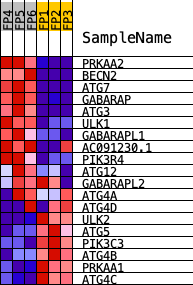
| PROBE | DESCRIPTION (from dataset) | GENE SYMBOL | GENE_TITLE | RANK IN GENE LIST | RANK METRIC SCORE | RUNNING ES | CORE ENRICHMENT | |
|---|---|---|---|---|---|---|---|---|
| 1 | PRKAA2 | Prkaa2 | 559 | 1.711 | 0.1266 | Yes | ||
| 2 | BECN2 | Gm38100 | 606 | 1.652 | 0.2808 | Yes | ||
| 3 | ATG7 | Atg7 | 849 | 1.413 | 0.3995 | Yes | ||
| 4 | GABARAP | Gabarap | 1054 | 1.256 | 0.5058 | Yes | ||
| 5 | ATG3 | Atg3 | 1808 | 0.893 | 0.5422 | Yes | ||
| 6 | ULK1 | Ulk1 | 2716 | 0.637 | 0.5443 | Yes | ||
| 7 | GABARAPL1 | Gabarapl1 | 4062 | 0.417 | 0.4972 | No | ||
| 8 | AC091230.1 | Ulk3 | 4312 | 0.393 | 0.5185 | No | ||
| 9 | PIK3R4 | Pik3r4 | 5791 | 0.182 | 0.4406 | No | ||
| 10 | ATG12 | Atg12 | 6133 | 0.142 | 0.4321 | No | ||
| 11 | GABARAPL2 | Gabarapl2 | 6912 | 0.056 | 0.3872 | No | ||
| 12 | ATG4A | Atg4a | 8307 | -0.036 | 0.3007 | No | ||
| 13 | ATG4D | Atg4d | 8319 | -0.037 | 0.3036 | No | ||
| 14 | ULK2 | Ulk2 | 9099 | -0.115 | 0.2642 | No | ||
| 15 | ATG5 | Atg5 | 9784 | -0.182 | 0.2374 | No | ||
| 16 | PIK3C3 | Pik3c3 | 9995 | -0.203 | 0.2432 | No | ||
| 17 | ATG4B | Atg4b | 10070 | -0.211 | 0.2585 | No | ||
| 18 | PRKAA1 | Prkaa1 | 12188 | -0.433 | 0.1632 | No | ||
| 19 | ATG4C | Atg4c | 12976 | -0.546 | 0.1644 | No |