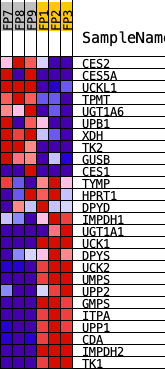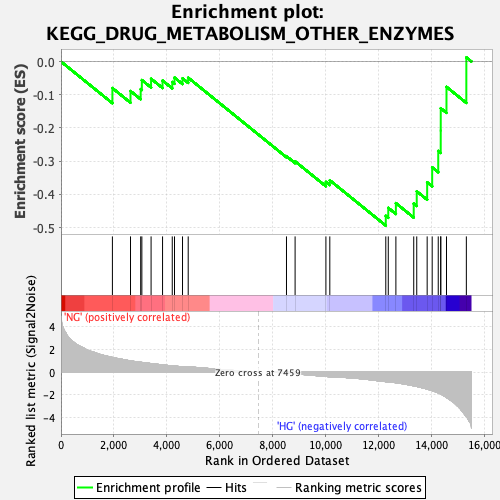
Profile of the Running ES Score & Positions of GeneSet Members on the Rank Ordered List
| Dataset | preliminary.phenotype.cls#NG_versus_HG.phenotype.cls#NG_versus_HG_repos |
| Phenotype | phenotype.cls#NG_versus_HG_repos |
| Upregulated in class | HG |
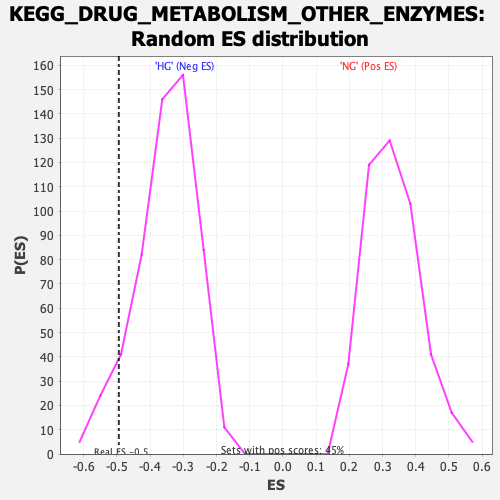
| GeneSet | KEGG_DRUG_METABOLISM_OTHER_ENZYMES |
| Enrichment Score (ES) | -0.49416637 |
| Normalized Enrichment Score (NES) | -1.4052473 |
| Nominal p-value | 0.07468124 |
| FDR q-value | 0.21862821 |
| FWER p-Value | 0.991 |
| PROBE | DESCRIPTION (from dataset) | GENE SYMBOL | GENE_TITLE | RANK IN GENE LIST | RANK METRIC SCORE | RUNNING ES | CORE ENRICHMENT | |
|---|---|---|---|---|---|---|---|---|
| 1 | CES2 | Ces2c | 1944 | 1.294 | -0.0798 | No | ||
| 2 | CES5A | Ces5a | 2629 | 0.998 | -0.0888 | No | ||
| 3 | UCKL1 | Uckl1 | 3014 | 0.865 | -0.0831 | No | ||
| 4 | TPMT | Tpmt | 3058 | 0.855 | -0.0558 | No | ||
| 5 | UGT1A6 | Ugt1a6a | 3407 | 0.751 | -0.0518 | No | ||
| 6 | UPB1 | Upb1 | 3841 | 0.638 | -0.0572 | No | ||
| 7 | XDH | Xdh | 4208 | 0.547 | -0.0616 | No | ||
| 8 | TK2 | Tk2 | 4293 | 0.532 | -0.0483 | No | ||
| 9 | GUSB | Gusb | 4596 | 0.491 | -0.0504 | No | ||
| 10 | CES1 | Ces1b | 4811 | 0.443 | -0.0486 | No | ||
| 11 | TYMP | Tymp | 8528 | -0.094 | -0.2851 | No | ||
| 12 | HPRT1 | Hprt | 8854 | -0.153 | -0.3006 | No | ||
| 13 | DPYD | Dpyd | 10019 | -0.375 | -0.3625 | No | ||
| 14 | IMPDH1 | Impdh1 | 10167 | -0.407 | -0.3577 | No | ||
| 15 | UGT1A1 | Ugt1a1 | 12284 | -0.834 | -0.4648 | Yes | ||
| 16 | UCK1 | Uck1 | 12378 | -0.852 | -0.4408 | Yes | ||
| 17 | DPYS | Dpys | 12666 | -0.930 | -0.4265 | Yes | ||
| 18 | UCK2 | Uck2 | 13341 | -1.199 | -0.4278 | Yes | ||
| 19 | UMPS | Umps | 13455 | -1.254 | -0.3909 | Yes | ||
| 20 | UPP2 | Upp2 | 13849 | -1.487 | -0.3639 | Yes | ||
| 21 | GMPS | Gmps | 14039 | -1.627 | -0.3187 | Yes | ||
| 22 | ITPA | Itpa | 14268 | -1.822 | -0.2693 | Yes | ||
| 23 | UPP1 | Upp1 | 14362 | -1.912 | -0.2080 | Yes | ||
| 24 | CDA | Cda | 14363 | -1.912 | -0.1406 | Yes | ||
| 25 | IMPDH2 | Impdh2 | 14580 | -2.224 | -0.0762 | Yes | ||
| 26 | TK1 | Tk1 | 15331 | -3.893 | 0.0125 | Yes |