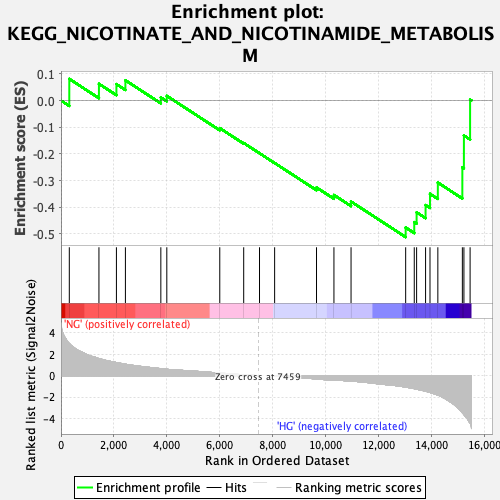
Profile of the Running ES Score & Positions of GeneSet Members on the Rank Ordered List
| Dataset | preliminary.phenotype.cls#NG_versus_HG.phenotype.cls#NG_versus_HG_repos |
| Phenotype | phenotype.cls#NG_versus_HG_repos |
| Upregulated in class | HG |
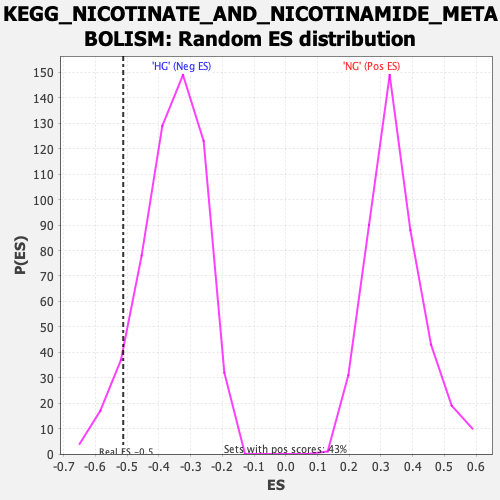
| GeneSet | KEGG_NICOTINATE_AND_NICOTINAMIDE_METABOLISM |
| Enrichment Score (ES) | -0.5119383 |
| Normalized Enrichment Score (NES) | -1.4247433 |
| Nominal p-value | 0.07205624 |
| FDR q-value | 0.21240589 |
| FWER p-Value | 0.985 |
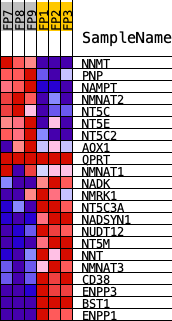
| PROBE | DESCRIPTION (from dataset) | GENE SYMBOL | GENE_TITLE | RANK IN GENE LIST | RANK METRIC SCORE | RUNNING ES | CORE ENRICHMENT | |
|---|---|---|---|---|---|---|---|---|
| 1 | NNMT | Nnmt | 314 | 2.992 | 0.0811 | No | ||
| 2 | PNP | Pnp | 1435 | 1.591 | 0.0627 | No | ||
| 3 | NAMPT | Nampt | 2096 | 1.223 | 0.0616 | No | ||
| 4 | NMNAT2 | Nmnat2 | 2436 | 1.067 | 0.0759 | No | ||
| 5 | NT5C | Nt5c | 3776 | 0.657 | 0.0117 | No | ||
| 6 | NT5E | Nt5e | 4002 | 0.598 | 0.0175 | No | ||
| 7 | NT5C2 | Nt5c2 | 6005 | 0.243 | -0.1034 | No | ||
| 8 | AOX1 | Aox1 | 6910 | 0.078 | -0.1591 | No | ||
| 9 | QPRT | Qprt | 7508 | 0.000 | -0.1976 | No | ||
| 10 | NMNAT1 | Nmnat1 | 8080 | -0.009 | -0.2341 | No | ||
| 11 | NADK | Nadk | 9664 | -0.304 | -0.3259 | No | ||
| 12 | NMRK1 | Nmrk1 | 10323 | -0.421 | -0.3541 | No | ||
| 13 | NT5C3A | Nt5c3 | 10970 | -0.503 | -0.3787 | No | ||
| 14 | NADSYN1 | Nadsyn1 | 13036 | -1.060 | -0.4760 | Yes | ||
| 15 | NUDT12 | Nudt12 | 13361 | -1.211 | -0.4559 | Yes | ||
| 16 | NT5M | Nt5m | 13450 | -1.252 | -0.4192 | Yes | ||
| 17 | NNT | Nnt | 13789 | -1.447 | -0.3920 | Yes | ||
| 18 | NMNAT3 | Nmnat3 | 13956 | -1.567 | -0.3496 | Yes | ||
| 19 | CD38 | Cd38 | 14253 | -1.804 | -0.3076 | Yes | ||
| 20 | ENPP3 | Enpp3 | 15180 | -3.458 | -0.2502 | Yes | ||
| 21 | BST1 | Bst1 | 15239 | -3.629 | -0.1310 | Yes | ||
| 22 | ENPP1 | Enpp1 | 15473 | -4.411 | 0.0034 | Yes |