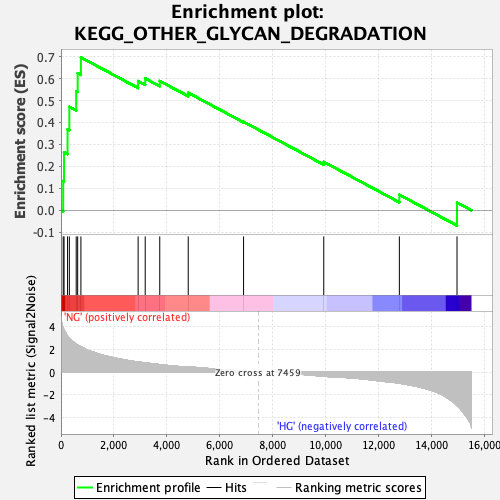
Profile of the Running ES Score & Positions of GeneSet Members on the Rank Ordered List
| Dataset | preliminary.phenotype.cls#NG_versus_HG.phenotype.cls#NG_versus_HG_repos |
| Phenotype | phenotype.cls#NG_versus_HG_repos |
| Upregulated in class | NG |
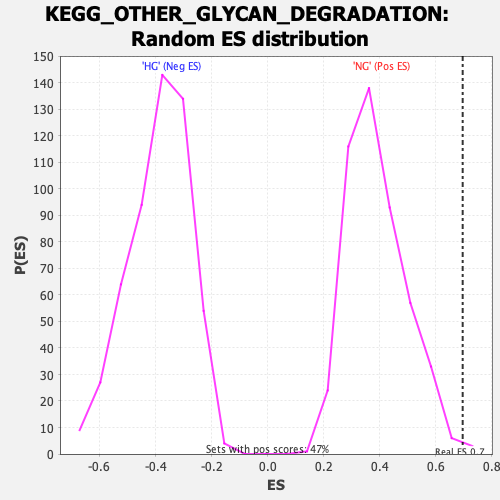
| GeneSet | KEGG_OTHER_GLYCAN_DEGRADATION |
| Enrichment Score (ES) | 0.6962401 |
| Normalized Enrichment Score (NES) | 1.7801642 |
| Nominal p-value | 0.006369427 |
| FDR q-value | 0.033833954 |
| FWER p-Value | 0.113 |
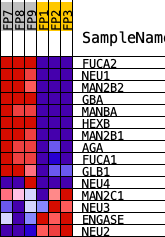
| PROBE | DESCRIPTION (from dataset) | GENE SYMBOL | GENE_TITLE | RANK IN GENE LIST | RANK METRIC SCORE | RUNNING ES | CORE ENRICHMENT | |
|---|---|---|---|---|---|---|---|---|
| 1 | FUCA2 | Fuca2 | 83 | 3.891 | 0.1334 | Yes | ||
| 2 | NEU1 | Neu1 | 115 | 3.729 | 0.2643 | Yes | ||
| 3 | MAN2B2 | Man2b2 | 248 | 3.172 | 0.3689 | Yes | ||
| 4 | GBA | Gba | 316 | 2.987 | 0.4710 | Yes | ||
| 5 | MANBA | Manba | 575 | 2.473 | 0.5426 | Yes | ||
| 6 | HEXB | Hexb | 630 | 2.389 | 0.6243 | Yes | ||
| 7 | MAN2B1 | Man2b1 | 753 | 2.240 | 0.6962 | Yes | ||
| 8 | AGA | Aga | 2917 | 0.891 | 0.5886 | No | ||
| 9 | FUCA1 | Fuca1 | 3185 | 0.819 | 0.6005 | No | ||
| 10 | GLB1 | Glb1 | 3735 | 0.665 | 0.5889 | No | ||
| 11 | NEU4 | Neu4 | 4812 | 0.443 | 0.5353 | No | ||
| 12 | MAN2C1 | Man2c1 | 6905 | 0.078 | 0.4032 | No | ||
| 13 | NEU3 | Neu3 | 9938 | -0.362 | 0.2206 | No | ||
| 14 | ENGASE | Engase | 12797 | -0.973 | 0.0711 | No | ||
| 15 | NEU2 | Neu2 | 14978 | -2.938 | 0.0353 | No |