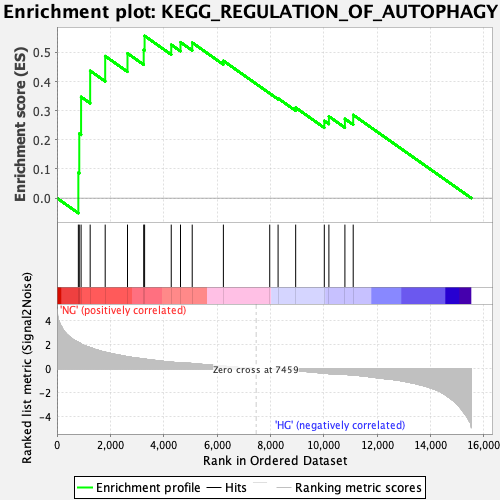
Profile of the Running ES Score & Positions of GeneSet Members on the Rank Ordered List
| Dataset | preliminary.phenotype.cls#NG_versus_HG.phenotype.cls#NG_versus_HG_repos |
| Phenotype | phenotype.cls#NG_versus_HG_repos |
| Upregulated in class | NG |
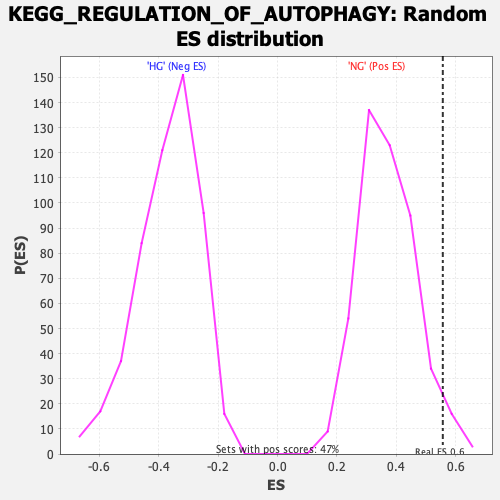
| GeneSet | KEGG_REGULATION_OF_AUTOPHAGY |
| Enrichment Score (ES) | 0.5565849 |
| Normalized Enrichment Score (NES) | 1.5036657 |
| Nominal p-value | 0.03821656 |
| FDR q-value | 0.15676224 |
| FWER p-Value | 0.815 |
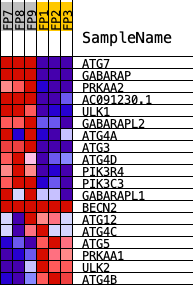
| PROBE | DESCRIPTION (from dataset) | GENE SYMBOL | GENE_TITLE | RANK IN GENE LIST | RANK METRIC SCORE | RUNNING ES | CORE ENRICHMENT | |
|---|---|---|---|---|---|---|---|---|
| 1 | ATG7 | Atg7 | 800 | 2.183 | 0.0872 | Yes | ||
| 2 | GABARAP | Gabarap | 835 | 2.141 | 0.2212 | Yes | ||
| 3 | PRKAA2 | Prkaa2 | 903 | 2.051 | 0.3473 | Yes | ||
| 4 | AC091230.1 | Ulk3 | 1243 | 1.751 | 0.4368 | Yes | ||
| 5 | ULK1 | Ulk1 | 1806 | 1.364 | 0.4872 | Yes | ||
| 6 | GABARAPL2 | Gabarapl2 | 2642 | 0.995 | 0.4967 | Yes | ||
| 7 | ATG4A | Atg4a | 3249 | 0.800 | 0.5085 | Yes | ||
| 8 | ATG3 | Atg3 | 3283 | 0.790 | 0.5566 | Yes | ||
| 9 | ATG4D | Atg4d | 4281 | 0.535 | 0.5263 | No | ||
| 10 | PIK3R4 | Pik3r4 | 4628 | 0.484 | 0.5347 | No | ||
| 11 | PIK3C3 | Pik3c3 | 5067 | 0.424 | 0.5334 | No | ||
| 12 | GABARAPL1 | Gabarapl1 | 6235 | 0.203 | 0.4711 | No | ||
| 13 | BECN2 | Gm38100 | 7972 | 0.000 | 0.3592 | No | ||
| 14 | ATG12 | Atg12 | 8285 | -0.049 | 0.3421 | No | ||
| 15 | ATG4C | Atg4c | 8944 | -0.168 | 0.3104 | No | ||
| 16 | ATG5 | Atg5 | 10017 | -0.375 | 0.2651 | No | ||
| 17 | PRKAA1 | Prkaa1 | 10189 | -0.413 | 0.2803 | No | ||
| 18 | ULK2 | Ulk2 | 10789 | -0.475 | 0.2719 | No | ||
| 19 | ATG4B | Atg4b | 11100 | -0.525 | 0.2854 | No |