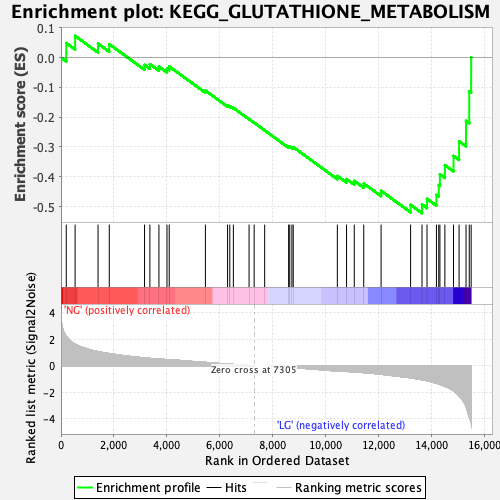
Profile of the Running ES Score & Positions of GeneSet Members on the Rank Ordered List
| Dataset | preliminary.phenotype.cls#NG_versus_LG.phenotype.cls#NG_versus_LG_repos |
| Phenotype | phenotype.cls#NG_versus_LG_repos |
| Upregulated in class | LG |
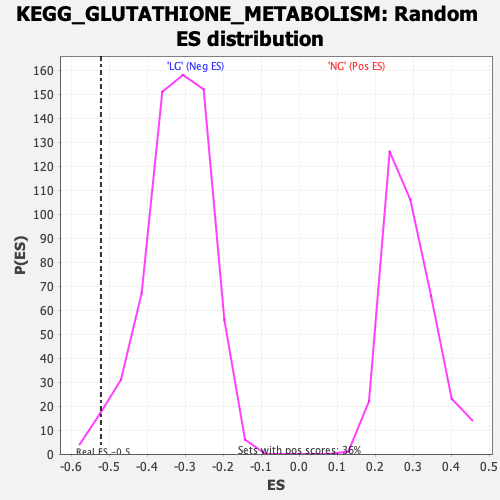
| GeneSet | KEGG_GLUTATHIONE_METABOLISM |
| Enrichment Score (ES) | -0.5220154 |
| Normalized Enrichment Score (NES) | -1.6227044 |
| Nominal p-value | 0.010903426 |
| FDR q-value | 0.047800906 |
| FWER p-Value | 0.605 |
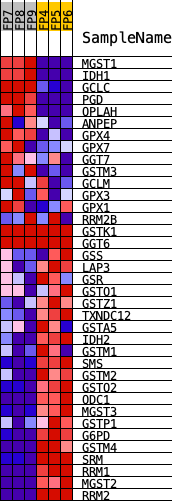
| PROBE | DESCRIPTION (from dataset) | GENE SYMBOL | GENE_TITLE | RANK IN GENE LIST | RANK METRIC SCORE | RUNNING ES | CORE ENRICHMENT | |
|---|---|---|---|---|---|---|---|---|
| 1 | MGST1 | Mgst1 | 199 | 2.223 | 0.0488 | No | ||
| 2 | IDH1 | Idh1 | 533 | 1.640 | 0.0727 | No | ||
| 3 | GCLC | Gclc | 1401 | 1.079 | 0.0467 | No | ||
| 4 | PGD | Pgd | 1826 | 0.924 | 0.0449 | No | ||
| 5 | OPLAH | Oplah | 3160 | 0.599 | -0.0245 | No | ||
| 6 | ANPEP | Anpep | 3362 | 0.559 | -0.0220 | No | ||
| 7 | GPX4 | Gpx4 | 3704 | 0.502 | -0.0301 | No | ||
| 8 | GPX7 | Gpx7 | 4008 | 0.464 | -0.0368 | No | ||
| 9 | GGT7 | Ggt7 | 4093 | 0.449 | -0.0298 | No | ||
| 10 | GSTM3 | Gstm5 | 5461 | 0.261 | -0.1108 | No | ||
| 11 | GCLM | Gclm | 6300 | 0.137 | -0.1611 | No | ||
| 12 | GPX3 | Gpx3 | 6384 | 0.124 | -0.1630 | No | ||
| 13 | GPX1 | Gpx1 | 6519 | 0.103 | -0.1688 | No | ||
| 14 | RRM2B | Rrm2b | 7113 | 0.027 | -0.2064 | No | ||
| 15 | GSTK1 | Gstk1 | 7305 | 0.000 | -0.2187 | No | ||
| 16 | GGT6 | Ggt6 | 7703 | 0.000 | -0.2443 | No | ||
| 17 | GSS | Gss | 8609 | -0.109 | -0.2997 | No | ||
| 18 | LAP3 | Lap3 | 8652 | -0.115 | -0.2993 | No | ||
| 19 | GSR | Gsr | 8733 | -0.125 | -0.3010 | No | ||
| 20 | GSTO1 | Gsto1 | 8783 | -0.134 | -0.3004 | No | ||
| 21 | GSTZ1 | Gstz1 | 10452 | -0.399 | -0.3971 | No | ||
| 22 | TXNDC12 | Txndc12 | 10800 | -0.423 | -0.4077 | No | ||
| 23 | GSTA5 | Gsta3 | 11092 | -0.460 | -0.4138 | No | ||
| 24 | IDH2 | Idh2 | 11450 | -0.511 | -0.4227 | No | ||
| 25 | GSTM1 | Gstm1 | 12106 | -0.639 | -0.4472 | No | ||
| 26 | SMS | Sms | 13223 | -0.903 | -0.4943 | Yes | ||
| 27 | GSTM2 | Gstm7 | 13654 | -1.049 | -0.4929 | Yes | ||
| 28 | GSTO2 | Gsto2 | 13843 | -1.123 | -0.4740 | Yes | ||
| 29 | ODC1 | Odc1 | 14200 | -1.319 | -0.4604 | Yes | ||
| 30 | MGST3 | Mgst3 | 14287 | -1.370 | -0.4280 | Yes | ||
| 31 | GSTP1 | Gstp1 | 14331 | -1.404 | -0.3918 | Yes | ||
| 32 | G6PD | G6pd2 | 14519 | -1.547 | -0.3610 | Yes | ||
| 33 | GSTM4 | Gstm4 | 14846 | -1.881 | -0.3299 | Yes | ||
| 34 | SRM | Srm | 15056 | -2.257 | -0.2808 | Yes | ||
| 35 | RRM1 | Rrm1 | 15319 | -3.083 | -0.2123 | Yes | ||
| 36 | MGST2 | Mgst2 | 15441 | -3.862 | -0.1131 | Yes | ||
| 37 | RRM2 | Rrm2 | 15513 | -4.272 | 0.0008 | Yes |