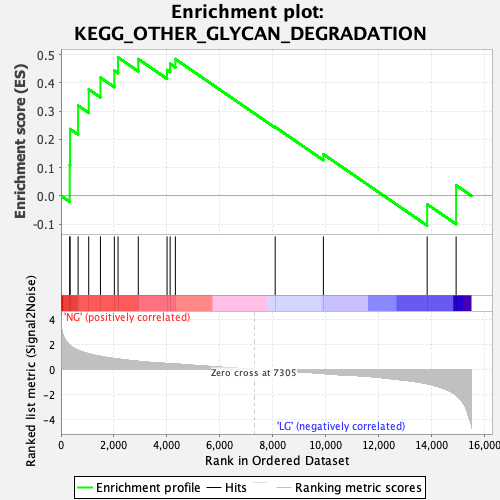
Profile of the Running ES Score & Positions of GeneSet Members on the Rank Ordered List
| Dataset | preliminary.phenotype.cls#NG_versus_LG.phenotype.cls#NG_versus_LG_repos |
| Phenotype | phenotype.cls#NG_versus_LG_repos |
| Upregulated in class | NG |
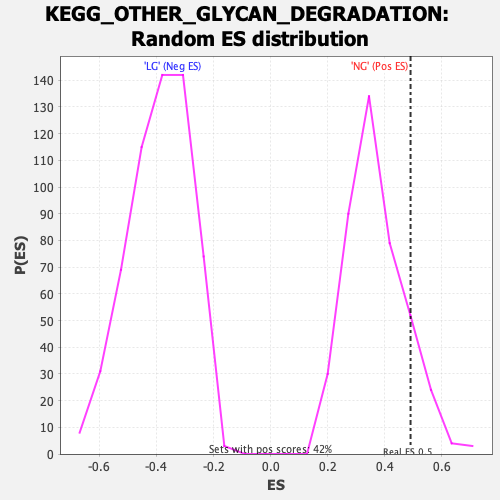
| GeneSet | KEGG_OTHER_GLYCAN_DEGRADATION |
| Enrichment Score (ES) | 0.49035278 |
| Normalized Enrichment Score (NES) | 1.3296534 |
| Nominal p-value | 0.12259615 |
| FDR q-value | 0.31381306 |
| FWER p-Value | 0.992 |
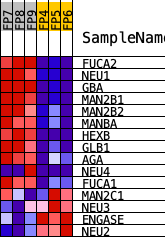
| PROBE | DESCRIPTION (from dataset) | GENE SYMBOL | GENE_TITLE | RANK IN GENE LIST | RANK METRIC SCORE | RUNNING ES | CORE ENRICHMENT | |
|---|---|---|---|---|---|---|---|---|
| 1 | FUCA2 | Fuca2 | 329 | 1.936 | 0.1093 | Yes | ||
| 2 | NEU1 | Neu1 | 344 | 1.904 | 0.2367 | Yes | ||
| 3 | GBA | Gba | 647 | 1.520 | 0.3196 | Yes | ||
| 4 | MAN2B1 | Man2b1 | 1048 | 1.239 | 0.3773 | Yes | ||
| 5 | MAN2B2 | Man2b2 | 1492 | 1.040 | 0.4188 | Yes | ||
| 6 | MANBA | Manba | 2017 | 0.869 | 0.4436 | Yes | ||
| 7 | HEXB | Hexb | 2158 | 0.828 | 0.4904 | Yes | ||
| 8 | GLB1 | Glb1 | 2923 | 0.644 | 0.4845 | No | ||
| 9 | AGA | Aga | 4011 | 0.463 | 0.4456 | No | ||
| 10 | NEU4 | Neu4 | 4128 | 0.443 | 0.4680 | No | ||
| 11 | FUCA1 | Fuca1 | 4326 | 0.433 | 0.4845 | No | ||
| 12 | MAN2C1 | Man2c1 | 8101 | -0.038 | 0.2437 | No | ||
| 13 | NEU3 | Neu3 | 9924 | -0.314 | 0.1474 | No | ||
| 14 | ENGASE | Engase | 13849 | -1.125 | -0.0298 | No | ||
| 15 | NEU2 | Neu2 | 14944 | -2.045 | 0.0375 | No |