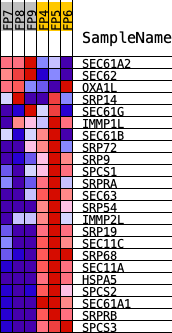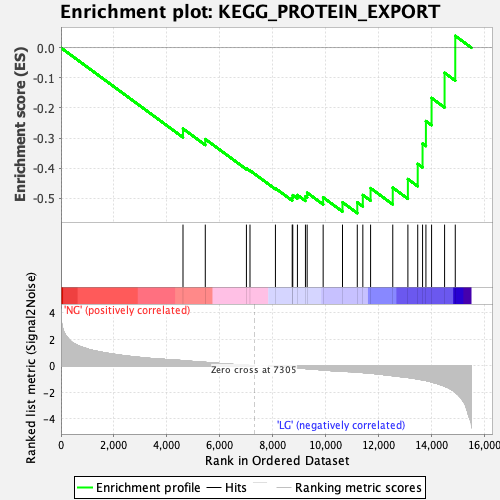
Profile of the Running ES Score & Positions of GeneSet Members on the Rank Ordered List
| Dataset | preliminary.phenotype.cls#NG_versus_LG.phenotype.cls#NG_versus_LG_repos |
| Phenotype | phenotype.cls#NG_versus_LG_repos |
| Upregulated in class | LG |
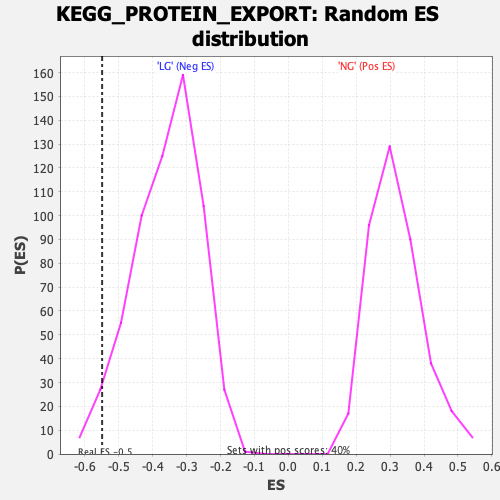
| GeneSet | KEGG_PROTEIN_EXPORT |
| Enrichment Score (ES) | -0.54913765 |
| Normalized Enrichment Score (NES) | -1.5278261 |
| Nominal p-value | 0.036363635 |
| FDR q-value | 0.09376605 |
| FWER p-Value | 0.897 |
| PROBE | DESCRIPTION (from dataset) | GENE SYMBOL | GENE_TITLE | RANK IN GENE LIST | RANK METRIC SCORE | RUNNING ES | CORE ENRICHMENT | |
|---|---|---|---|---|---|---|---|---|
| 1 | SEC61A2 | Sec61a2 | 4614 | 0.387 | -0.2686 | No | ||
| 2 | SEC62 | Sec62 | 5457 | 0.261 | -0.3034 | No | ||
| 3 | OXA1L | Oxa1l | 7013 | 0.041 | -0.4006 | No | ||
| 4 | SRP14 | Srp14 | 7148 | 0.022 | -0.4076 | No | ||
| 5 | SEC61G | Sec61g | 8110 | -0.039 | -0.4667 | No | ||
| 6 | IMMP1L | Immp1l | 8745 | -0.127 | -0.4980 | No | ||
| 7 | SEC61B | Gm10320 | 8766 | -0.131 | -0.4895 | No | ||
| 8 | SRP72 | Srp72 | 8942 | -0.158 | -0.4890 | No | ||
| 9 | SRP9 | Srp9 | 9245 | -0.204 | -0.4932 | No | ||
| 10 | SPCS1 | Spcs1 | 9310 | -0.214 | -0.4813 | No | ||
| 11 | SRPRA | Srpr | 9915 | -0.312 | -0.4969 | No | ||
| 12 | SEC63 | Sec63 | 10647 | -0.413 | -0.5131 | No | ||
| 13 | SRP54 | Srp54a | 11206 | -0.477 | -0.5134 | Yes | ||
| 14 | IMMP2L | Immp2l | 11416 | -0.506 | -0.4890 | Yes | ||
| 15 | SRP19 | Srp19 | 11709 | -0.557 | -0.4661 | Yes | ||
| 16 | SEC11C | Sec11c | 12548 | -0.741 | -0.4646 | Yes | ||
| 17 | SRP68 | Srp68 | 13120 | -0.874 | -0.4360 | Yes | ||
| 18 | SEC11A | Sec11a | 13492 | -0.991 | -0.3857 | Yes | ||
| 19 | HSPA5 | Hspa5 | 13675 | -1.058 | -0.3182 | Yes | ||
| 20 | SPCS2 | Spcs2 | 13802 | -1.107 | -0.2435 | Yes | ||
| 21 | SEC61A1 | Sec61a1 | 14016 | -1.209 | -0.1667 | Yes | ||
| 22 | SRPRB | Srprb | 14508 | -1.539 | -0.0831 | Yes | ||
| 23 | SPCS3 | Arxes1 | 14912 | -1.985 | 0.0395 | Yes |