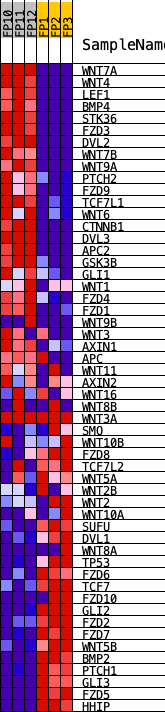
Profile of the Running ES Score & Positions of GeneSet Members on the Rank Ordered List
| Dataset | preliminary.phenotype.cls#NGP_versus_HG.phenotype.cls#NGP_versus_HG_repos |
| Phenotype | phenotype.cls#NGP_versus_HG_repos |
| Upregulated in class | NGP |
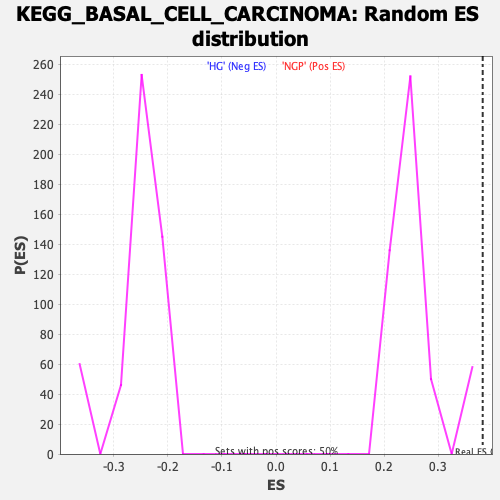
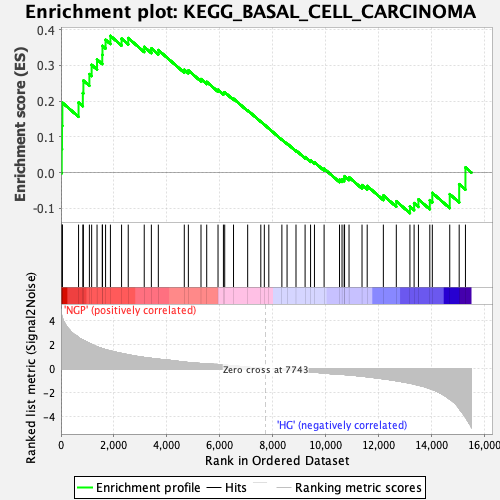
| GeneSet | KEGG_BASAL_CELL_CARCINOMA |
| Enrichment Score (ES) | 0.38266507 |
| Normalized Enrichment Score (NES) | 1.4828346 |
| Nominal p-value | 0.0 |
| FDR q-value | 0.34086627 |
| FWER p-Value | 0.76 |
| PROBE | DESCRIPTION (from dataset) | GENE SYMBOL | GENE_TITLE | RANK IN GENE LIST | RANK METRIC SCORE | RUNNING ES | CORE ENRICHMENT | |
|---|---|---|---|---|---|---|---|---|
| 1 | WNT7A | Wnt7a | 28 | 4.432 | 0.0663 | Yes | ||
| 2 | WNT4 | Wnt4 | 39 | 4.292 | 0.1316 | Yes | ||
| 3 | LEF1 | Lef1 | 52 | 4.231 | 0.1958 | Yes | ||
| 4 | BMP4 | Bmp4 | 664 | 2.599 | 0.1963 | Yes | ||
| 5 | STK36 | Stk36 | 826 | 2.391 | 0.2226 | Yes | ||
| 6 | FZD3 | Fzd3 | 847 | 2.369 | 0.2577 | Yes | ||
| 7 | DVL2 | Dvl2 | 1074 | 2.122 | 0.2757 | Yes | ||
| 8 | WNT7B | Wnt7b | 1159 | 2.034 | 0.3015 | Yes | ||
| 9 | WNT9A | Wnt9a | 1363 | 1.834 | 0.3166 | Yes | ||
| 10 | PTCH2 | Ptch2 | 1561 | 1.673 | 0.3295 | Yes | ||
| 11 | FZD9 | Fzd9 | 1569 | 1.670 | 0.3547 | Yes | ||
| 12 | TCF7L1 | Tcf7l1 | 1686 | 1.589 | 0.3717 | Yes | ||
| 13 | WNT6 | Wnt6 | 1869 | 1.481 | 0.3827 | Yes | ||
| 14 | CTNNB1 | Ctnnb1 | 2291 | 1.271 | 0.3750 | No | ||
| 15 | DVL3 | Dvl3 | 2543 | 1.156 | 0.3765 | No | ||
| 16 | APC2 | Apc2 | 3148 | 0.936 | 0.3519 | No | ||
| 17 | GSK3B | Gsk3b | 3418 | 0.860 | 0.3477 | No | ||
| 18 | GLI1 | Gli1 | 3681 | 0.793 | 0.3429 | No | ||
| 19 | WNT1 | Wnt1 | 4663 | 0.550 | 0.2880 | No | ||
| 20 | FZD4 | Fzd4 | 4817 | 0.516 | 0.2860 | No | ||
| 21 | FZD1 | Fzd1 | 5295 | 0.429 | 0.2618 | No | ||
| 22 | WNT9B | Wnt9b | 5511 | 0.401 | 0.2540 | No | ||
| 23 | WNT3 | Wnt3 | 5939 | 0.349 | 0.2318 | No | ||
| 24 | AXIN1 | Axin1 | 6143 | 0.308 | 0.2234 | No | ||
| 25 | APC | Apc | 6192 | 0.299 | 0.2249 | No | ||
| 26 | WNT11 | Wnt11 | 6525 | 0.230 | 0.2070 | No | ||
| 27 | AXIN2 | Axin2 | 7060 | 0.125 | 0.1744 | No | ||
| 28 | WNT16 | Wnt16 | 7557 | 0.036 | 0.1429 | No | ||
| 29 | WNT8B | Wnt8b | 7690 | 0.010 | 0.1345 | No | ||
| 30 | WNT3A | Wnt3a | 7860 | 0.000 | 0.1236 | No | ||
| 31 | SMO | Smo | 8354 | -0.066 | 0.0927 | No | ||
| 32 | WNT10B | Wnt10b | 8550 | -0.101 | 0.0817 | No | ||
| 33 | FZD8 | Fzd8 | 8888 | -0.158 | 0.0623 | No | ||
| 34 | TCF7L2 | Tcf7l2 | 9232 | -0.220 | 0.0436 | No | ||
| 35 | WNT5A | Wnt5a | 9439 | -0.261 | 0.0342 | No | ||
| 36 | WNT2B | Wnt2b | 9586 | -0.286 | 0.0292 | No | ||
| 37 | WNT2 | Wnt2 | 9951 | -0.360 | 0.0112 | No | ||
| 38 | WNT10A | Wnt10a | 10534 | -0.442 | -0.0196 | No | ||
| 39 | SUFU | Sufu | 10629 | -0.462 | -0.0186 | No | ||
| 40 | DVL1 | Dvl1 | 10710 | -0.483 | -0.0163 | No | ||
| 41 | WNT8A | Wnt8a | 10725 | -0.485 | -0.0098 | No | ||
| 42 | TP53 | Trp53 | 10894 | -0.512 | -0.0128 | No | ||
| 43 | FZD6 | Fzd6 | 11385 | -0.626 | -0.0348 | No | ||
| 44 | TCF7 | Tcf7 | 11581 | -0.668 | -0.0372 | No | ||
| 45 | FZD10 | Fzd10 | 12192 | -0.842 | -0.0637 | No | ||
| 46 | GLI2 | Gli2 | 12682 | -0.999 | -0.0799 | No | ||
| 47 | FZD2 | Fzd2 | 13197 | -1.206 | -0.0946 | No | ||
| 48 | FZD7 | Fzd7 | 13355 | -1.281 | -0.0851 | No | ||
| 49 | WNT5B | Wnt5b | 13519 | -1.368 | -0.0746 | No | ||
| 50 | BMP2 | Bmp2 | 13949 | -1.653 | -0.0769 | No | ||
| 51 | PTCH1 | Ptch1 | 14044 | -1.721 | -0.0566 | No | ||
| 52 | GLI3 | Gli3 | 14703 | -2.537 | -0.0601 | No | ||
| 53 | FZD5 | Fzd5 | 15060 | -3.314 | -0.0322 | No | ||
| 54 | HHIP | Hhip | 15297 | -4.047 | 0.0147 | No |