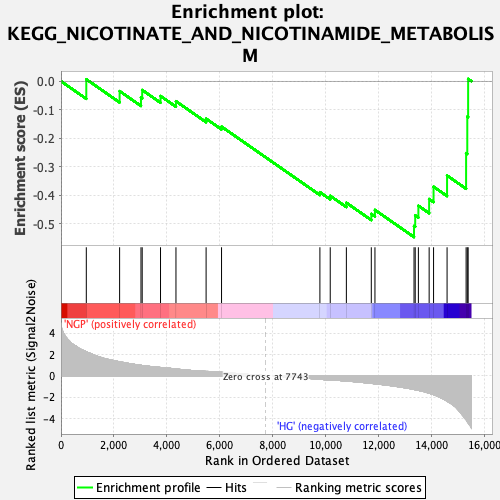
Profile of the Running ES Score & Positions of GeneSet Members on the Rank Ordered List
| Dataset | preliminary.phenotype.cls#NGP_versus_HG.phenotype.cls#NGP_versus_HG_repos |
| Phenotype | phenotype.cls#NGP_versus_HG_repos |
| Upregulated in class | HG |
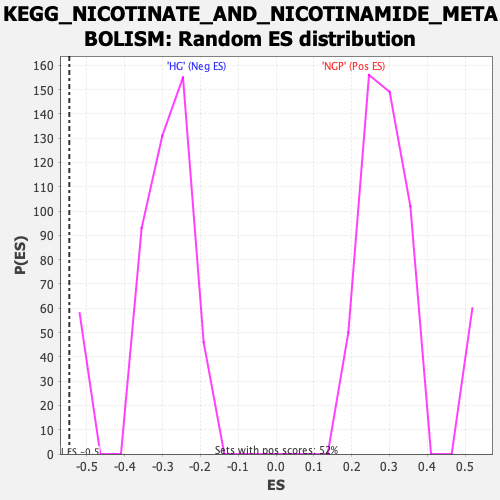
| GeneSet | KEGG_NICOTINATE_AND_NICOTINAMIDE_METABOLISM |
| Enrichment Score (ES) | -0.5465259 |
| Normalized Enrichment Score (NES) | -1.7530233 |
| Nominal p-value | 0.0 |
| FDR q-value | 0.058000028 |
| FWER p-Value | 0.058 |
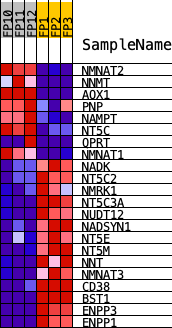
| PROBE | DESCRIPTION (from dataset) | GENE SYMBOL | GENE_TITLE | RANK IN GENE LIST | RANK METRIC SCORE | RUNNING ES | CORE ENRICHMENT | |
|---|---|---|---|---|---|---|---|---|
| 1 | NMNAT2 | Nmnat2 | 957 | 2.249 | 0.0068 | No | ||
| 2 | NNMT | Nnmt | 2217 | 1.302 | -0.0347 | No | ||
| 3 | AOX1 | Aox1 | 3025 | 0.972 | -0.0571 | No | ||
| 4 | PNP | Pnp | 3071 | 0.961 | -0.0308 | No | ||
| 5 | NAMPT | Nampt | 3764 | 0.771 | -0.0519 | No | ||
| 6 | NT5C | Nt5c | 4348 | 0.634 | -0.0702 | No | ||
| 7 | QPRT | Qprt | 5488 | 0.401 | -0.1314 | No | ||
| 8 | NMNAT1 | Nmnat1 | 6072 | 0.322 | -0.1592 | No | ||
| 9 | NADK | Nadk | 9792 | -0.327 | -0.3891 | No | ||
| 10 | NT5C2 | Nt5c2 | 10183 | -0.406 | -0.4019 | No | ||
| 11 | NMRK1 | Nmrk1 | 10793 | -0.495 | -0.4261 | No | ||
| 12 | NT5C3A | Nt5c3 | 11736 | -0.708 | -0.4653 | No | ||
| 13 | NUDT12 | Nudt12 | 11874 | -0.750 | -0.4513 | No | ||
| 14 | NADSYN1 | Nadsyn1 | 13352 | -1.279 | -0.5075 | Yes | ||
| 15 | NT5E | Nt5e | 13397 | -1.305 | -0.4706 | Yes | ||
| 16 | NT5M | Nt5m | 13517 | -1.366 | -0.4366 | Yes | ||
| 17 | NNT | Nnt | 13924 | -1.633 | -0.4130 | Yes | ||
| 18 | NMNAT3 | Nmnat3 | 14091 | -1.768 | -0.3699 | Yes | ||
| 19 | CD38 | Cd38 | 14602 | -2.364 | -0.3307 | Yes | ||
| 20 | BST1 | Bst1 | 15322 | -4.096 | -0.2523 | Yes | ||
| 21 | ENPP3 | Enpp3 | 15367 | -4.299 | -0.1241 | Yes | ||
| 22 | ENPP1 | Enpp1 | 15399 | -4.404 | 0.0081 | Yes |