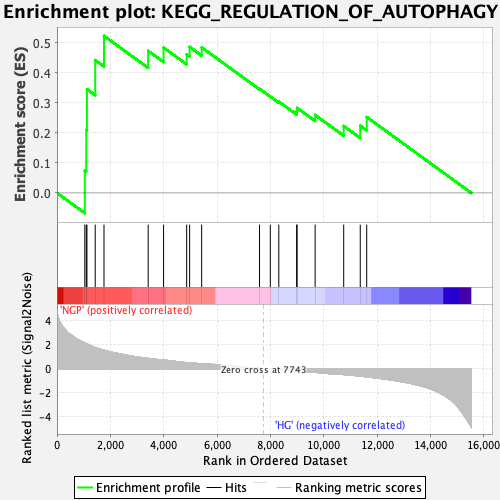
Profile of the Running ES Score & Positions of GeneSet Members on the Rank Ordered List
| Dataset | preliminary.phenotype.cls#NGP_versus_HG.phenotype.cls#NGP_versus_HG_repos |
| Phenotype | phenotype.cls#NGP_versus_HG_repos |
| Upregulated in class | NGP |
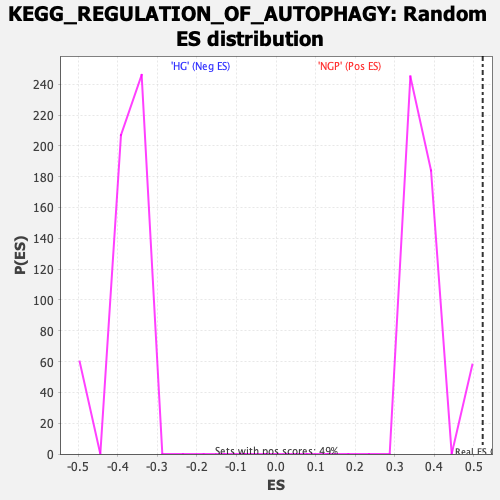
| GeneSet | KEGG_REGULATION_OF_AUTOPHAGY |
| Enrichment Score (ES) | 0.52295345 |
| Normalized Enrichment Score (NES) | 1.3689747 |
| Nominal p-value | 0.0 |
| FDR q-value | 0.28866413 |
| FWER p-Value | 0.899 |
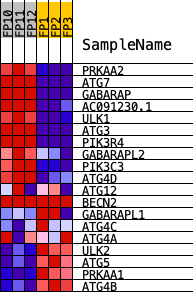
| PROBE | DESCRIPTION (from dataset) | GENE SYMBOL | GENE_TITLE | RANK IN GENE LIST | RANK METRIC SCORE | RUNNING ES | CORE ENRICHMENT | |
|---|---|---|---|---|---|---|---|---|
| 1 | PRKAA2 | Prkaa2 | 1042 | 2.148 | 0.0747 | Yes | ||
| 2 | ATG7 | Atg7 | 1097 | 2.102 | 0.2100 | Yes | ||
| 3 | GABARAP | Gabarap | 1122 | 2.075 | 0.3455 | Yes | ||
| 4 | AC091230.1 | Ulk3 | 1432 | 1.767 | 0.4422 | Yes | ||
| 5 | ULK1 | Ulk1 | 1761 | 1.543 | 0.5230 | Yes | ||
| 6 | ATG3 | Atg3 | 3417 | 0.861 | 0.4731 | No | ||
| 7 | PIK3R4 | Pik3r4 | 3994 | 0.724 | 0.4838 | No | ||
| 8 | GABARAPL2 | Gabarapl2 | 4859 | 0.505 | 0.4614 | No | ||
| 9 | PIK3C3 | Pik3c3 | 4970 | 0.486 | 0.4864 | No | ||
| 10 | ATG4D | Atg4d | 5421 | 0.412 | 0.4846 | No | ||
| 11 | ATG12 | Atg12 | 7589 | 0.029 | 0.3468 | No | ||
| 12 | BECN2 | Gm38100 | 7993 | 0.000 | 0.3208 | No | ||
| 13 | GABARAPL1 | Gabarapl1 | 8312 | -0.058 | 0.3041 | No | ||
| 14 | ATG4C | Atg4c | 8981 | -0.173 | 0.2725 | No | ||
| 15 | ATG4A | Atg4a | 8997 | -0.175 | 0.2831 | No | ||
| 16 | ULK2 | Ulk2 | 9673 | -0.303 | 0.2596 | No | ||
| 17 | ATG5 | Atg5 | 10744 | -0.488 | 0.2228 | No | ||
| 18 | PRKAA1 | Prkaa1 | 11364 | -0.619 | 0.2238 | No | ||
| 19 | ATG4B | Atg4b | 11606 | -0.674 | 0.2527 | No |