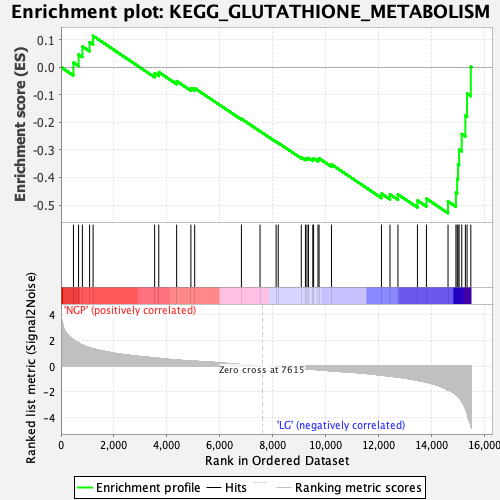
Profile of the Running ES Score & Positions of GeneSet Members on the Rank Ordered List
| Dataset | preliminary.phenotype.cls#NGP_versus_LG.phenotype.cls#NGP_versus_LG_repos |
| Phenotype | phenotype.cls#NGP_versus_LG_repos |
| Upregulated in class | LG |
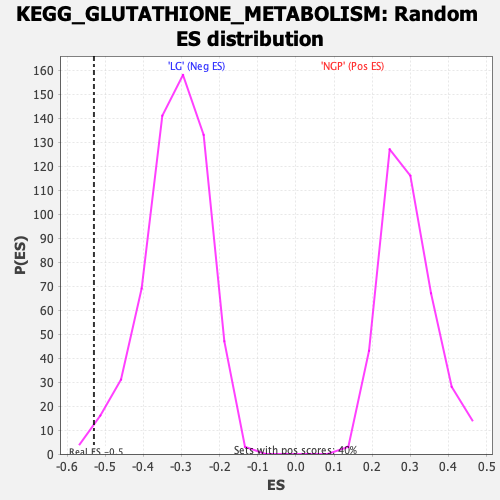
| GeneSet | KEGG_GLUTATHIONE_METABOLISM |
| Enrichment Score (ES) | -0.5295229 |
| Normalized Enrichment Score (NES) | -1.6782428 |
| Nominal p-value | 0.006644518 |
| FDR q-value | 0.036559638 |
| FWER p-Value | 0.398 |
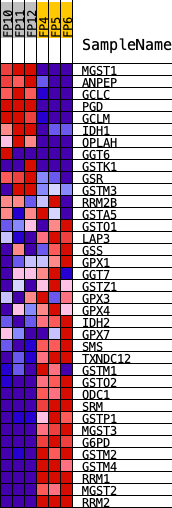
| PROBE | DESCRIPTION (from dataset) | GENE SYMBOL | GENE_TITLE | RANK IN GENE LIST | RANK METRIC SCORE | RUNNING ES | CORE ENRICHMENT | |
|---|---|---|---|---|---|---|---|---|
| 1 | MGST1 | Mgst1 | 470 | 2.056 | 0.0171 | No | ||
| 2 | ANPEP | Anpep | 664 | 1.814 | 0.0465 | No | ||
| 3 | GCLC | Gclc | 809 | 1.648 | 0.0752 | No | ||
| 4 | PGD | Pgd | 1081 | 1.440 | 0.0909 | No | ||
| 5 | GCLM | Gclm | 1213 | 1.356 | 0.1137 | No | ||
| 6 | IDH1 | Idh1 | 3541 | 0.638 | -0.0218 | No | ||
| 7 | OPLAH | Oplah | 3698 | 0.604 | -0.0179 | No | ||
| 8 | GGT6 | Ggt6 | 4374 | 0.478 | -0.0505 | No | ||
| 9 | GSTK1 | Gstk1 | 4913 | 0.401 | -0.0759 | No | ||
| 10 | GSR | Gsr | 5056 | 0.395 | -0.0760 | No | ||
| 11 | GSTM3 | Gstm5 | 6824 | 0.120 | -0.1873 | No | ||
| 12 | RRM2B | Rrm2b | 7528 | 0.015 | -0.2323 | No | ||
| 13 | GSTA5 | Gsta3 | 8136 | -0.041 | -0.2706 | No | ||
| 14 | GSTO1 | Gsto1 | 8216 | -0.050 | -0.2745 | No | ||
| 15 | LAP3 | Lap3 | 9088 | -0.177 | -0.3267 | No | ||
| 16 | GSS | Gss | 9245 | -0.201 | -0.3321 | No | ||
| 17 | GPX1 | Gpx1 | 9303 | -0.209 | -0.3310 | No | ||
| 18 | GGT7 | Ggt7 | 9359 | -0.220 | -0.3295 | No | ||
| 19 | GSTZ1 | Gstz1 | 9524 | -0.246 | -0.3344 | No | ||
| 20 | GPX3 | Gpx3 | 9554 | -0.249 | -0.3305 | No | ||
| 21 | GPX4 | Gpx4 | 9719 | -0.277 | -0.3347 | No | ||
| 22 | IDH2 | Idh2 | 9761 | -0.283 | -0.3308 | No | ||
| 23 | GPX7 | Gpx7 | 10232 | -0.367 | -0.3527 | No | ||
| 24 | SMS | Sms | 12120 | -0.696 | -0.4585 | No | ||
| 25 | TXNDC12 | Txndc12 | 12443 | -0.771 | -0.4615 | No | ||
| 26 | GSTM1 | Gstm1 | 12744 | -0.845 | -0.4613 | No | ||
| 27 | GSTO2 | Gsto2 | 13481 | -1.099 | -0.4835 | No | ||
| 28 | ODC1 | Odc1 | 13821 | -1.238 | -0.4768 | No | ||
| 29 | SRM | Srm | 14638 | -1.847 | -0.4869 | Yes | ||
| 30 | GSTP1 | Gstp1 | 14937 | -2.214 | -0.4551 | Yes | ||
| 31 | MGST3 | Mgst3 | 14984 | -2.299 | -0.4050 | Yes | ||
| 32 | G6PD | G6pd2 | 15016 | -2.360 | -0.3526 | Yes | ||
| 33 | GSTM2 | Gstm7 | 15057 | -2.430 | -0.2991 | Yes | ||
| 34 | GSTM4 | Gstm4 | 15157 | -2.739 | -0.2423 | Yes | ||
| 35 | RRM1 | Rrm1 | 15294 | -3.282 | -0.1754 | Yes | ||
| 36 | MGST2 | Mgst2 | 15358 | -3.635 | -0.0956 | Yes | ||
| 37 | RRM2 | Rrm2 | 15500 | -4.610 | 0.0016 | Yes |