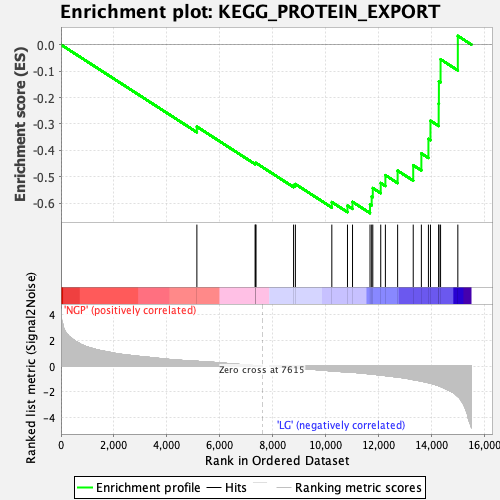
Profile of the Running ES Score & Positions of GeneSet Members on the Rank Ordered List
| Dataset | preliminary.phenotype.cls#NGP_versus_LG.phenotype.cls#NGP_versus_LG_repos |
| Phenotype | phenotype.cls#NGP_versus_LG_repos |
| Upregulated in class | LG |
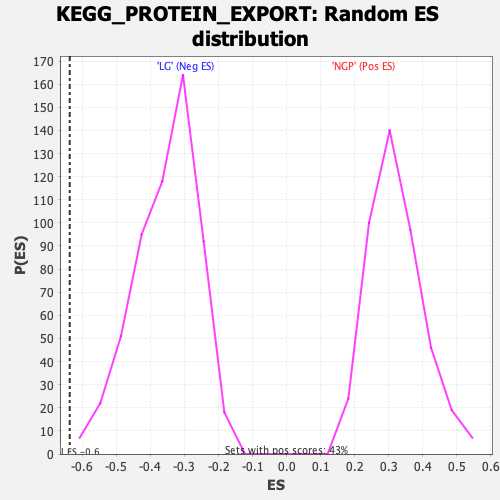
| GeneSet | KEGG_PROTEIN_EXPORT |
| Enrichment Score (ES) | -0.6374164 |
| Normalized Enrichment Score (NES) | -1.797124 |
| Nominal p-value | 0.0017636684 |
| FDR q-value | 0.011374772 |
| FWER p-Value | 0.118 |
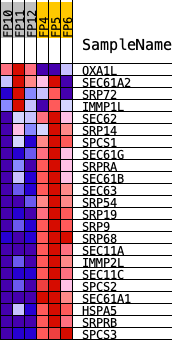
| PROBE | DESCRIPTION (from dataset) | GENE SYMBOL | GENE_TITLE | RANK IN GENE LIST | RANK METRIC SCORE | RUNNING ES | CORE ENRICHMENT | |
|---|---|---|---|---|---|---|---|---|
| 1 | OXA1L | Oxa1l | 5139 | 0.381 | -0.3102 | No | ||
| 2 | SEC61A2 | Sec61a2 | 7341 | 0.043 | -0.4498 | No | ||
| 3 | SRP72 | Srp72 | 7366 | 0.038 | -0.4492 | No | ||
| 4 | IMMP1L | Immp1l | 7370 | 0.038 | -0.4472 | No | ||
| 5 | SEC62 | Sec62 | 8796 | -0.141 | -0.5313 | No | ||
| 6 | SRP14 | Srp14 | 8865 | -0.149 | -0.5274 | No | ||
| 7 | SPCS1 | Spcs1 | 10243 | -0.370 | -0.5955 | No | ||
| 8 | SEC61G | Sec61g | 10835 | -0.441 | -0.6090 | Yes | ||
| 9 | SRPRA | Srpr | 11026 | -0.475 | -0.5948 | Yes | ||
| 10 | SEC61B | Gm10320 | 11688 | -0.596 | -0.6041 | Yes | ||
| 11 | SEC63 | Sec63 | 11751 | -0.606 | -0.5743 | Yes | ||
| 12 | SRP54 | Srp54a | 11793 | -0.617 | -0.5425 | Yes | ||
| 13 | SRP19 | Srp19 | 12093 | -0.688 | -0.5234 | Yes | ||
| 14 | SRP9 | Srp9 | 12269 | -0.731 | -0.4938 | Yes | ||
| 15 | SRP68 | Srp68 | 12732 | -0.843 | -0.4766 | Yes | ||
| 16 | SEC11A | Sec11a | 13322 | -1.044 | -0.4562 | Yes | ||
| 17 | IMMP2L | Immp2l | 13630 | -1.158 | -0.4114 | Yes | ||
| 18 | SEC11C | Sec11c | 13897 | -1.287 | -0.3566 | Yes | ||
| 19 | SPCS2 | Spcs2 | 13974 | -1.322 | -0.2877 | Yes | ||
| 20 | SEC61A1 | Sec61a1 | 14285 | -1.513 | -0.2232 | Yes | ||
| 21 | HSPA5 | Hspa5 | 14293 | -1.520 | -0.1388 | Yes | ||
| 22 | SRPRB | Srprb | 14356 | -1.565 | -0.0554 | Yes | ||
| 23 | SPCS3 | Arxes1 | 15009 | -2.340 | 0.0333 | Yes |