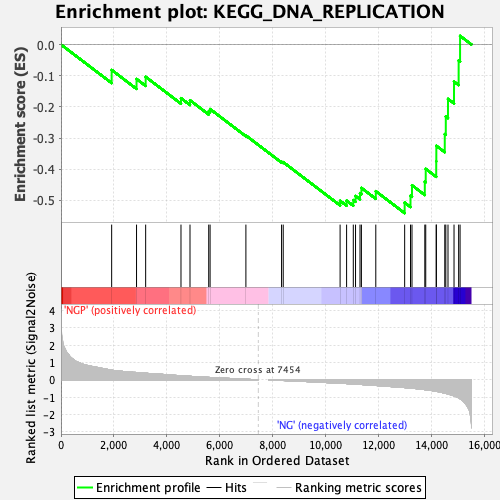
Profile of the Running ES Score & Positions of GeneSet Members on the Rank Ordered List
| Dataset | preliminary.phenotype.cls#NGP_versus_NG.phenotype.cls#NGP_versus_NG_repos |
| Phenotype | phenotype.cls#NGP_versus_NG_repos |
| Upregulated in class | NG |
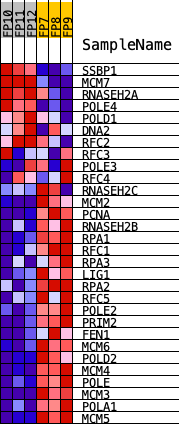
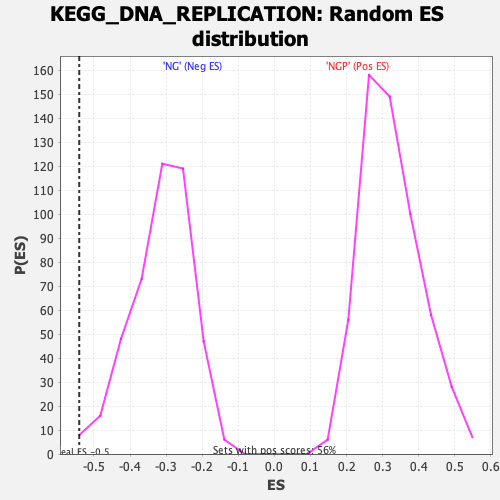
| GeneSet | KEGG_DNA_REPLICATION |
| Enrichment Score (ES) | -0.5408482 |
| Normalized Enrichment Score (NES) | -1.7288325 |
| Nominal p-value | 0.00913242 |
| FDR q-value | 0.053261224 |
| FWER p-Value | 0.209 |
| PROBE | DESCRIPTION (from dataset) | GENE SYMBOL | GENE_TITLE | RANK IN GENE LIST | RANK METRIC SCORE | RUNNING ES | CORE ENRICHMENT | |
|---|---|---|---|---|---|---|---|---|
| 1 | SSBP1 | Ssbp1 | 1916 | 0.556 | -0.0816 | No | ||
| 2 | MCM7 | Mcm7 | 2857 | 0.420 | -0.1105 | No | ||
| 3 | RNASEH2A | Rnaseh2a | 3202 | 0.385 | -0.1036 | No | ||
| 4 | POLE4 | Pole4 | 4538 | 0.233 | -0.1721 | No | ||
| 5 | POLD1 | Pold1 | 4879 | 0.201 | -0.1788 | No | ||
| 6 | DNA2 | Dna2 | 5587 | 0.139 | -0.2139 | No | ||
| 7 | RFC2 | Rfc2 | 5639 | 0.135 | -0.2070 | No | ||
| 8 | RFC3 | Rfc3 | 6993 | 0.035 | -0.2917 | No | ||
| 9 | POLE3 | Pole3 | 8342 | -0.034 | -0.3761 | No | ||
| 10 | RFC4 | Rfc4 | 8405 | -0.037 | -0.3773 | No | ||
| 11 | RNASEH2C | Rnaseh2c | 10556 | -0.196 | -0.5012 | No | ||
| 12 | MCM2 | Mcm2 | 10802 | -0.215 | -0.5008 | No | ||
| 13 | PCNA | Pcna | 11055 | -0.238 | -0.4990 | No | ||
| 14 | RNASEH2B | Rnaseh2b | 11140 | -0.246 | -0.4858 | No | ||
| 15 | RPA1 | Rpa1 | 11309 | -0.262 | -0.4768 | No | ||
| 16 | RFC1 | Rfc1 | 11362 | -0.268 | -0.4599 | No | ||
| 17 | RPA3 | Rpa3 | 11906 | -0.324 | -0.4704 | No | ||
| 18 | LIG1 | Lig1 | 12998 | -0.447 | -0.5071 | Yes | ||
| 19 | RPA2 | Rpa2 | 13219 | -0.479 | -0.4850 | Yes | ||
| 20 | RFC5 | Rfc5 | 13275 | -0.491 | -0.4515 | Yes | ||
| 21 | POLE2 | Pole2 | 13760 | -0.566 | -0.4400 | Yes | ||
| 22 | PRIM2 | Prim2 | 13795 | -0.573 | -0.3989 | Yes | ||
| 23 | FEN1 | Fen1 | 14192 | -0.659 | -0.3746 | Yes | ||
| 24 | MCM6 | Mcm6 | 14196 | -0.661 | -0.3249 | Yes | ||
| 25 | POLD2 | Pold2 | 14515 | -0.768 | -0.2873 | Yes | ||
| 26 | MCM4 | Mcm4 | 14554 | -0.779 | -0.2309 | Yes | ||
| 27 | POLE | Pole | 14637 | -0.819 | -0.1743 | Yes | ||
| 28 | MCM3 | Mcm3 | 14865 | -0.927 | -0.1189 | Yes | ||
| 29 | POLA1 | Pola1 | 15040 | -1.045 | -0.0511 | Yes | ||
| 30 | MCM5 | Mcm5 | 15094 | -1.089 | 0.0278 | Yes |