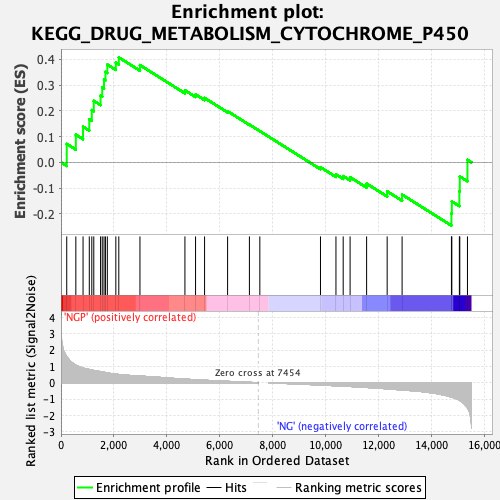
Profile of the Running ES Score & Positions of GeneSet Members on the Rank Ordered List
| Dataset | preliminary.phenotype.cls#NGP_versus_NG.phenotype.cls#NGP_versus_NG_repos |
| Phenotype | phenotype.cls#NGP_versus_NG_repos |
| Upregulated in class | NGP |
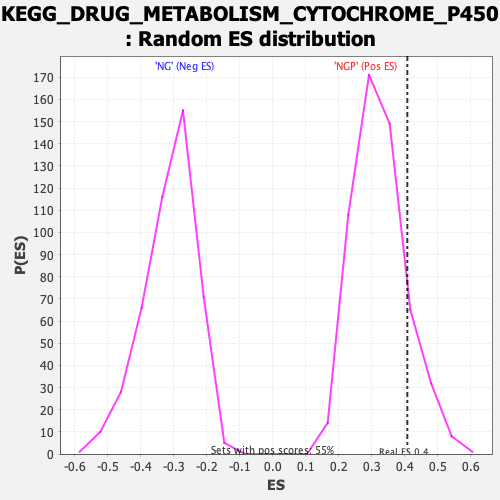
| GeneSet | KEGG_DRUG_METABOLISM_CYTOCHROME_P450 |
| Enrichment Score (ES) | 0.40765825 |
| Normalized Enrichment Score (NES) | 1.2622763 |
| Nominal p-value | 0.13138686 |
| FDR q-value | 0.5811324 |
| FWER p-Value | 1.0 |
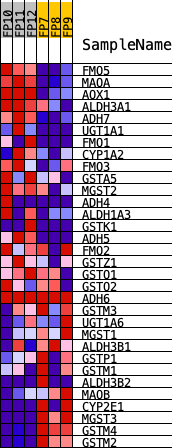
| PROBE | DESCRIPTION (from dataset) | GENE SYMBOL | GENE_TITLE | RANK IN GENE LIST | RANK METRIC SCORE | RUNNING ES | CORE ENRICHMENT | |
|---|---|---|---|---|---|---|---|---|
| 1 | FMO5 | Fmo5 | 217 | 1.583 | 0.0717 | Yes | ||
| 2 | MAOA | Maoa | 561 | 1.072 | 0.1076 | Yes | ||
| 3 | AOX1 | Aox1 | 834 | 0.897 | 0.1387 | Yes | ||
| 4 | ALDH3A1 | Aldh3a1 | 1070 | 0.808 | 0.1672 | Yes | ||
| 5 | ADH7 | Adh7 | 1165 | 0.776 | 0.2032 | Yes | ||
| 6 | UGT1A1 | Ugt1a1 | 1240 | 0.748 | 0.2389 | Yes | ||
| 7 | FMO1 | Fmo1 | 1496 | 0.678 | 0.2592 | Yes | ||
| 8 | CYP1A2 | Cyp1a2 | 1560 | 0.659 | 0.2908 | Yes | ||
| 9 | FMO3 | Fmo3 | 1627 | 0.640 | 0.3212 | Yes | ||
| 10 | GSTA5 | Gsta3 | 1681 | 0.625 | 0.3517 | Yes | ||
| 11 | MGST2 | Mgst2 | 1752 | 0.604 | 0.3799 | Yes | ||
| 12 | ADH4 | Adh4 | 2074 | 0.523 | 0.3875 | Yes | ||
| 13 | ALDH1A3 | Aldh1a3 | 2186 | 0.505 | 0.4077 | Yes | ||
| 14 | GSTK1 | Gstk1 | 2986 | 0.401 | 0.3778 | No | ||
| 15 | ADH5 | Adh5 | 4687 | 0.218 | 0.2799 | No | ||
| 16 | FMO2 | Fmo2 | 5089 | 0.182 | 0.2639 | No | ||
| 17 | GSTZ1 | Gstz1 | 5430 | 0.154 | 0.2502 | No | ||
| 18 | GSTO1 | Gsto1 | 6301 | 0.084 | 0.1986 | No | ||
| 19 | GSTO2 | Gsto2 | 7126 | 0.025 | 0.1468 | No | ||
| 20 | ADH6 | Adh6b | 7520 | 0.000 | 0.1214 | No | ||
| 21 | GSTM3 | Gstm5 | 9814 | -0.141 | -0.0189 | No | ||
| 22 | UGT1A6 | Ugt1a6a | 10399 | -0.184 | -0.0467 | No | ||
| 23 | MGST1 | Mgst1 | 10673 | -0.204 | -0.0532 | No | ||
| 24 | ALDH3B1 | Aldh3b1 | 10934 | -0.226 | -0.0577 | No | ||
| 25 | GSTP1 | Gstp1 | 11559 | -0.286 | -0.0825 | No | ||
| 26 | GSTM1 | Gstm1 | 12336 | -0.371 | -0.1125 | No | ||
| 27 | ALDH3B2 | Aldh3b3 | 12901 | -0.438 | -0.1252 | No | ||
| 28 | MAOB | Maob | 14767 | -0.872 | -0.1983 | No | ||
| 29 | CYP2E1 | Cyp2e1 | 14782 | -0.880 | -0.1516 | No | ||
| 30 | MGST3 | Mgst3 | 15067 | -1.063 | -0.1124 | No | ||
| 31 | GSTM4 | Gstm4 | 15083 | -1.081 | -0.0548 | No | ||
| 32 | GSTM2 | Gstm7 | 15373 | -1.537 | 0.0098 | No |