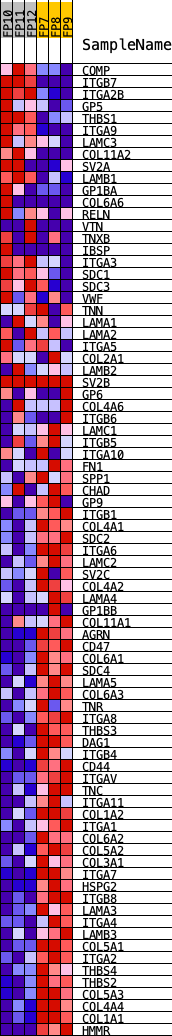
Profile of the Running ES Score & Positions of GeneSet Members on the Rank Ordered List
| Dataset | preliminary.phenotype.cls#NGP_versus_NG.phenotype.cls#NGP_versus_NG_repos |
| Phenotype | phenotype.cls#NGP_versus_NG_repos |
| Upregulated in class | NG |
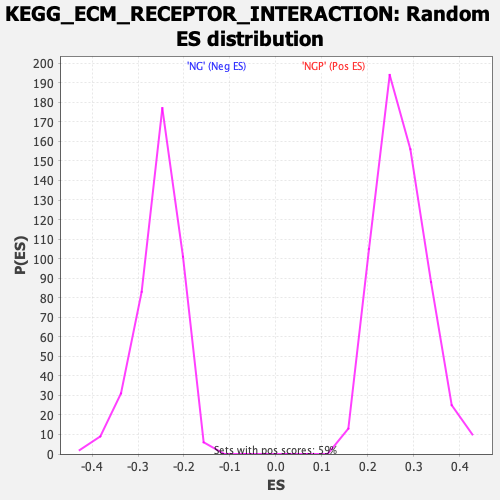
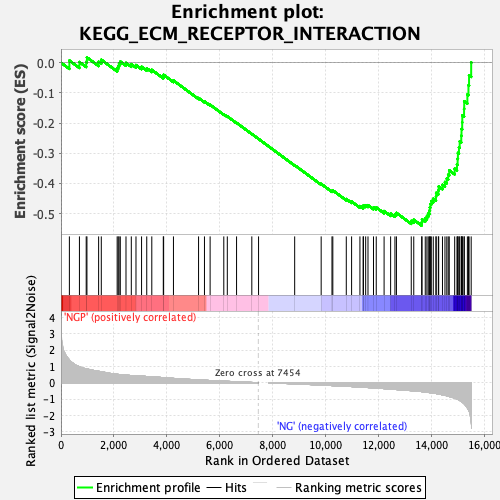
| GeneSet | KEGG_ECM_RECEPTOR_INTERACTION |
| Enrichment Score (ES) | -0.5397734 |
| Normalized Enrichment Score (NES) | -2.110861 |
| Nominal p-value | 0.0 |
| FDR q-value | 0.0 |
| FWER p-Value | 0.0 |
| PROBE | DESCRIPTION (from dataset) | GENE SYMBOL | GENE_TITLE | RANK IN GENE LIST | RANK METRIC SCORE | RUNNING ES | CORE ENRICHMENT | |
|---|---|---|---|---|---|---|---|---|
| 1 | COMP | Comp | 317 | 1.391 | 0.0072 | No | ||
| 2 | ITGB7 | Itgb7 | 697 | 0.982 | 0.0022 | No | ||
| 3 | ITGA2B | Itga2b | 953 | 0.849 | 0.0026 | No | ||
| 4 | GP5 | Gp5 | 981 | 0.837 | 0.0175 | No | ||
| 5 | THBS1 | Thbs1 | 1423 | 0.703 | 0.0029 | No | ||
| 6 | ITGA9 | Itga9 | 1524 | 0.669 | 0.0098 | No | ||
| 7 | LAMC3 | Lamc3 | 2124 | 0.517 | -0.0188 | No | ||
| 8 | COL11A2 | Col11a2 | 2163 | 0.509 | -0.0111 | No | ||
| 9 | SV2A | Sv2a | 2197 | 0.504 | -0.0032 | No | ||
| 10 | LAMB1 | Lamb1 | 2243 | 0.497 | 0.0038 | No | ||
| 11 | GP1BA | Gp1ba | 2458 | 0.470 | -0.0007 | No | ||
| 12 | COL6A6 | Col6a6 | 2659 | 0.440 | -0.0049 | No | ||
| 13 | RELN | Reln | 2836 | 0.424 | -0.0078 | No | ||
| 14 | VTN | Vtn | 3047 | 0.401 | -0.0135 | No | ||
| 15 | TNXB | Tnxb | 3243 | 0.378 | -0.0186 | No | ||
| 16 | IBSP | Ibsp | 3434 | 0.356 | -0.0238 | No | ||
| 17 | ITGA3 | Itga3 | 3869 | 0.310 | -0.0457 | No | ||
| 18 | SDC1 | Sdc1 | 3882 | 0.309 | -0.0403 | No | ||
| 19 | SDC3 | Sdc3 | 4253 | 0.265 | -0.0590 | No | ||
| 20 | VWF | Vwf | 5203 | 0.173 | -0.1170 | No | ||
| 21 | TNN | Tnn | 5426 | 0.154 | -0.1283 | No | ||
| 22 | LAMA1 | Lama1 | 5640 | 0.135 | -0.1394 | No | ||
| 23 | LAMA2 | Lama2 | 6157 | 0.094 | -0.1710 | No | ||
| 24 | ITGA5 | Itga5 | 6290 | 0.084 | -0.1778 | No | ||
| 25 | COL2A1 | Col2a1 | 6640 | 0.061 | -0.1992 | No | ||
| 26 | LAMB2 | Lamb2 | 7217 | 0.018 | -0.2362 | No | ||
| 27 | SV2B | Sv2b | 7472 | 0.000 | -0.2526 | No | ||
| 28 | GP6 | Gp6 | 8838 | -0.068 | -0.3396 | No | ||
| 29 | COL4A6 | Col4a6 | 9840 | -0.142 | -0.4016 | No | ||
| 30 | ITGB6 | Itgb6 | 10249 | -0.172 | -0.4246 | No | ||
| 31 | LAMC1 | Lamc1 | 10281 | -0.175 | -0.4231 | No | ||
| 32 | ITGB5 | Itgb5 | 10790 | -0.214 | -0.4518 | No | ||
| 33 | ITGA10 | Gm42957 | 10991 | -0.232 | -0.4601 | No | ||
| 34 | FN1 | Fn1 | 11306 | -0.262 | -0.4752 | No | ||
| 35 | SPP1 | Spp1 | 11427 | -0.274 | -0.4775 | No | ||
| 36 | CHAD | Chad | 11439 | -0.275 | -0.4728 | No | ||
| 37 | GP9 | Gp9 | 11523 | -0.283 | -0.4725 | No | ||
| 38 | ITGB1 | Itgb1 | 11611 | -0.292 | -0.4723 | No | ||
| 39 | COL4A1 | Col4a1 | 11819 | -0.313 | -0.4795 | No | ||
| 40 | SDC2 | Sdc2 | 11923 | -0.326 | -0.4797 | No | ||
| 41 | ITGA6 | Itga6 | 12220 | -0.357 | -0.4917 | No | ||
| 42 | LAMC2 | Lamc2 | 12467 | -0.387 | -0.5000 | No | ||
| 43 | SV2C | Sv2c | 12630 | -0.406 | -0.5024 | No | ||
| 44 | COL4A2 | Col4a2 | 12687 | -0.414 | -0.4978 | No | ||
| 45 | LAMA4 | Lama4 | 13247 | -0.484 | -0.5243 | No | ||
| 46 | GP1BB | Gp1bb | 13342 | -0.499 | -0.5205 | No | ||
| 47 | COL11A1 | Col11a1 | 13641 | -0.540 | -0.5290 | Yes | ||
| 48 | AGRN | Agrn | 13655 | -0.543 | -0.5191 | Yes | ||
| 49 | CD47 | Cd47 | 13777 | -0.569 | -0.5156 | Yes | ||
| 50 | COL6A1 | Col6a1 | 13839 | -0.580 | -0.5080 | Yes | ||
| 51 | SDC4 | Sdc4 | 13890 | -0.590 | -0.4995 | Yes | ||
| 52 | LAMA5 | Lama5 | 13933 | -0.600 | -0.4903 | Yes | ||
| 53 | COL6A3 | Col6a3 | 13951 | -0.603 | -0.4794 | Yes | ||
| 54 | TNR | Tnr | 13971 | -0.608 | -0.4685 | Yes | ||
| 55 | ITGA8 | Itga8 | 14006 | -0.615 | -0.4584 | Yes | ||
| 56 | THBS3 | Thbs3 | 14080 | -0.632 | -0.4506 | Yes | ||
| 57 | DAG1 | Dag1 | 14182 | -0.657 | -0.4441 | Yes | ||
| 58 | ITGB4 | Itgb4 | 14189 | -0.658 | -0.4314 | Yes | ||
| 59 | CD44 | Cd44 | 14272 | -0.686 | -0.4230 | Yes | ||
| 60 | ITGAV | Itgav | 14285 | -0.689 | -0.4101 | Yes | ||
| 61 | TNC | Tnc | 14428 | -0.735 | -0.4046 | Yes | ||
| 62 | ITGA11 | Itga11 | 14522 | -0.769 | -0.3953 | Yes | ||
| 63 | COL1A2 | Col1a2 | 14592 | -0.795 | -0.3840 | Yes | ||
| 64 | ITGA1 | Itga1 | 14645 | -0.821 | -0.3710 | Yes | ||
| 65 | COL6A2 | Col6a2 | 14684 | -0.839 | -0.3568 | Yes | ||
| 66 | COL5A2 | Col5a2 | 14890 | -0.944 | -0.3513 | Yes | ||
| 67 | COL3A1 | Col3a1 | 14977 | -0.993 | -0.3371 | Yes | ||
| 68 | ITGA7 | Itga7 | 15001 | -1.007 | -0.3185 | Yes | ||
| 69 | HSPG2 | Hspg2 | 15012 | -1.017 | -0.2989 | Yes | ||
| 70 | ITGB8 | Itgb8 | 15052 | -1.054 | -0.2805 | Yes | ||
| 71 | LAMA3 | Lama3 | 15079 | -1.075 | -0.2608 | Yes | ||
| 72 | ITGA4 | Itga4 | 15139 | -1.134 | -0.2420 | Yes | ||
| 73 | LAMB3 | Lamb3 | 15148 | -1.149 | -0.2196 | Yes | ||
| 74 | COL5A1 | Col5a1 | 15174 | -1.182 | -0.1978 | Yes | ||
| 75 | ITGA2 | Itga2 | 15178 | -1.187 | -0.1743 | Yes | ||
| 76 | THBS4 | Thbs4 | 15245 | -1.275 | -0.1532 | Yes | ||
| 77 | THBS2 | Thbs2 | 15251 | -1.286 | -0.1279 | Yes | ||
| 78 | COL5A3 | Col5a3 | 15370 | -1.534 | -0.1051 | Yes | ||
| 79 | COL4A4 | Col4a4 | 15411 | -1.647 | -0.0749 | Yes | ||
| 80 | COL1A1 | Col1a1 | 15434 | -1.720 | -0.0421 | Yes | ||
| 81 | HMMR | Hmmr | 15514 | -2.406 | 0.0007 | Yes |