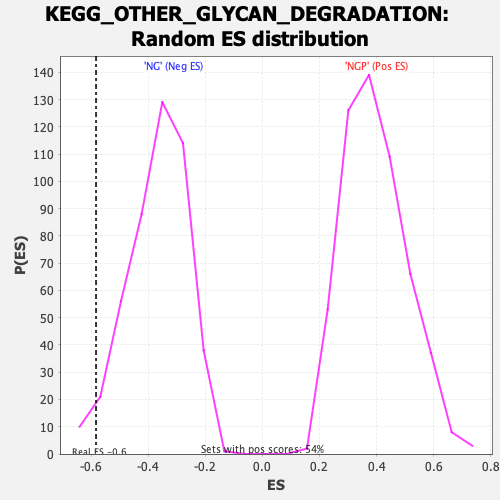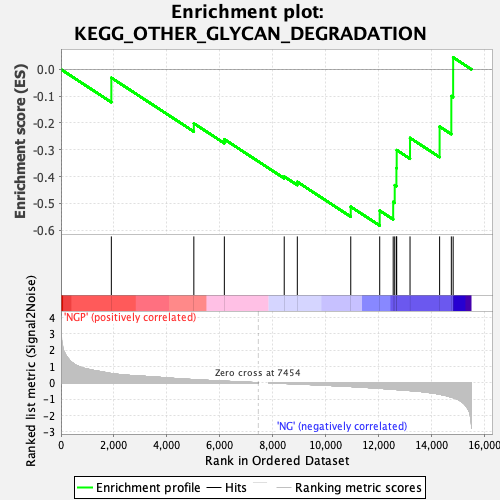
Profile of the Running ES Score & Positions of GeneSet Members on the Rank Ordered List
| Dataset | preliminary.phenotype.cls#NGP_versus_NG.phenotype.cls#NGP_versus_NG_repos |
| Phenotype | phenotype.cls#NGP_versus_NG_repos |
| Upregulated in class | NG |
| GeneSet | KEGG_OTHER_GLYCAN_DEGRADATION |
| Enrichment Score (ES) | -0.5832387 |
| Normalized Enrichment Score (NES) | -1.581088 |
| Nominal p-value | 0.026258206 |
| FDR q-value | 0.10746328 |
| FWER p-Value | 0.628 |
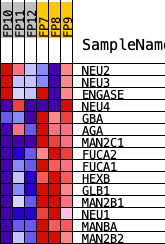
| PROBE | DESCRIPTION (from dataset) | GENE SYMBOL | GENE_TITLE | RANK IN GENE LIST | RANK METRIC SCORE | RUNNING ES | CORE ENRICHMENT | |
|---|---|---|---|---|---|---|---|---|
| 1 | NEU2 | Neu2 | 1904 | 0.559 | -0.0313 | No | ||
| 2 | NEU3 | Neu3 | 5024 | 0.188 | -0.2016 | No | ||
| 3 | ENGASE | Engase | 6178 | 0.092 | -0.2609 | No | ||
| 4 | NEU4 | Neu4 | 8443 | -0.041 | -0.4003 | No | ||
| 5 | GBA | Gba | 8938 | -0.075 | -0.4199 | No | ||
| 6 | AGA | Aga | 10959 | -0.229 | -0.5127 | No | ||
| 7 | MAN2C1 | Man2c1 | 12054 | -0.342 | -0.5273 | Yes | ||
| 8 | FUCA2 | Fuca2 | 12564 | -0.399 | -0.4948 | Yes | ||
| 9 | FUCA1 | Fuca1 | 12622 | -0.405 | -0.4323 | Yes | ||
| 10 | HEXB | Hexb | 12686 | -0.414 | -0.3687 | Yes | ||
| 11 | GLB1 | Glb1 | 12697 | -0.415 | -0.3014 | Yes | ||
| 12 | MAN2B1 | Man2b1 | 13201 | -0.477 | -0.2558 | Yes | ||
| 13 | NEU1 | Neu1 | 14320 | -0.699 | -0.2135 | Yes | ||
| 14 | MANBA | Manba | 14763 | -0.870 | -0.0996 | Yes | ||
| 15 | MAN2B2 | Man2b2 | 14832 | -0.909 | 0.0447 | Yes |