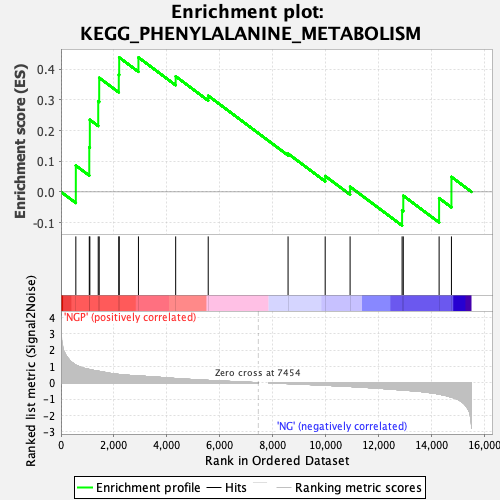
Profile of the Running ES Score & Positions of GeneSet Members on the Rank Ordered List
| Dataset | preliminary.phenotype.cls#NGP_versus_NG.phenotype.cls#NGP_versus_NG_repos |
| Phenotype | phenotype.cls#NGP_versus_NG_repos |
| Upregulated in class | NGP |
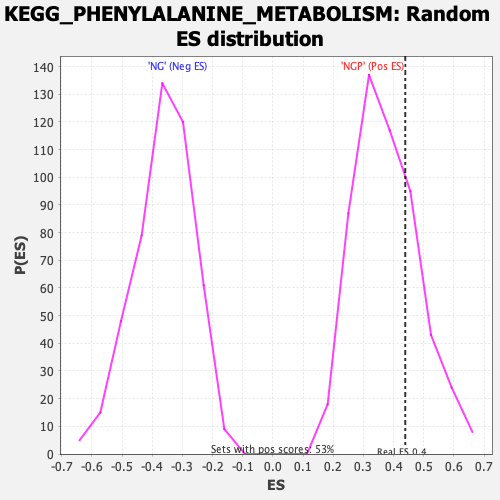
| GeneSet | KEGG_PHENYLALANINE_METABOLISM |
| Enrichment Score (ES) | 0.43860537 |
| Normalized Enrichment Score (NES) | 1.164934 |
| Nominal p-value | 0.27032137 |
| FDR q-value | 0.79849946 |
| FWER p-Value | 1.0 |
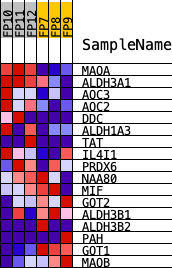
| PROBE | DESCRIPTION (from dataset) | GENE SYMBOL | GENE_TITLE | RANK IN GENE LIST | RANK METRIC SCORE | RUNNING ES | CORE ENRICHMENT | |
|---|---|---|---|---|---|---|---|---|
| 1 | MAOA | Maoa | 561 | 1.072 | 0.0859 | Yes | ||
| 2 | ALDH3A1 | Aldh3a1 | 1070 | 0.808 | 0.1453 | Yes | ||
| 3 | AOC3 | Aoc3 | 1091 | 0.801 | 0.2353 | Yes | ||
| 4 | AOC2 | Aoc2 | 1408 | 0.708 | 0.2956 | Yes | ||
| 5 | DDC | Ddc | 1445 | 0.692 | 0.3722 | Yes | ||
| 6 | ALDH1A3 | Aldh1a3 | 2186 | 0.505 | 0.3820 | Yes | ||
| 7 | TAT | Tat | 2201 | 0.503 | 0.4385 | Yes | ||
| 8 | IL4I1 | Il4i1 | 2929 | 0.412 | 0.4386 | Yes | ||
| 9 | PRDX6 | Prdx6 | 4337 | 0.254 | 0.3769 | No | ||
| 10 | NAA80 | Naa80 | 5568 | 0.141 | 0.3136 | No | ||
| 11 | MIF | Mif | 8588 | -0.050 | 0.1247 | No | ||
| 12 | GOT2 | Got2 | 9992 | -0.153 | 0.0517 | No | ||
| 13 | ALDH3B1 | Aldh3b1 | 10934 | -0.226 | 0.0168 | No | ||
| 14 | ALDH3B2 | Aldh3b3 | 12901 | -0.438 | -0.0601 | No | ||
| 15 | PAH | Pah | 12946 | -0.443 | -0.0125 | No | ||
| 16 | GOT1 | Got1 | 14301 | -0.695 | -0.0206 | No | ||
| 17 | MAOB | Maob | 14767 | -0.872 | 0.0489 | No |