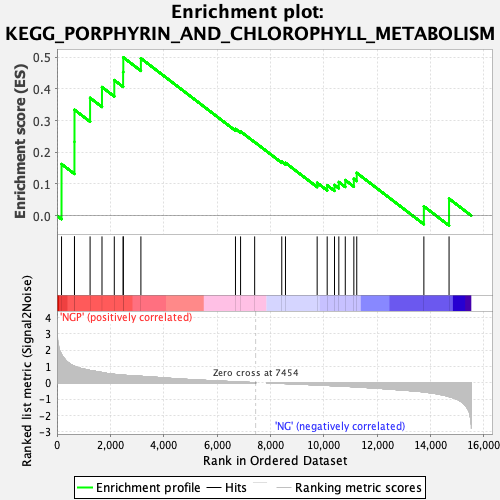
Profile of the Running ES Score & Positions of GeneSet Members on the Rank Ordered List
| Dataset | preliminary.phenotype.cls#NGP_versus_NG.phenotype.cls#NGP_versus_NG_repos |
| Phenotype | phenotype.cls#NGP_versus_NG_repos |
| Upregulated in class | NGP |
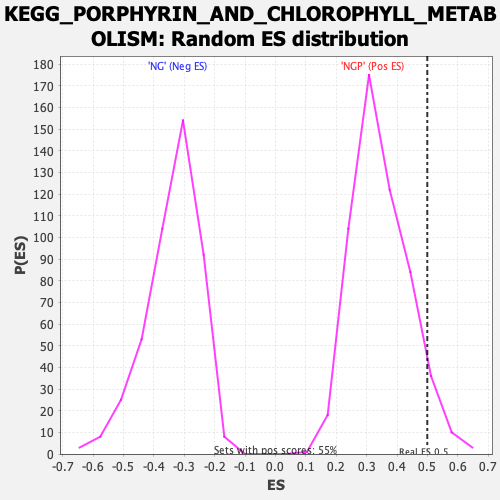
| GeneSet | KEGG_PORPHYRIN_AND_CHLOROPHYLL_METABOLISM |
| Enrichment Score (ES) | 0.4995817 |
| Normalized Enrichment Score (NES) | 1.4407029 |
| Nominal p-value | 0.065099455 |
| FDR q-value | 0.36566514 |
| FWER p-Value | 0.979 |
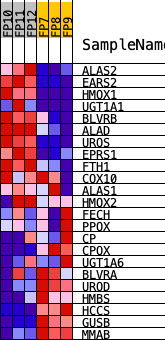
| PROBE | DESCRIPTION (from dataset) | GENE SYMBOL | GENE_TITLE | RANK IN GENE LIST | RANK METRIC SCORE | RUNNING ES | CORE ENRICHMENT | |
|---|---|---|---|---|---|---|---|---|
| 1 | ALAS2 | Alas2 | 170 | 1.729 | 0.1630 | Yes | ||
| 2 | EARS2 | Ears2 | 654 | 1.007 | 0.2331 | Yes | ||
| 3 | HMOX1 | Hmox1 | 656 | 1.006 | 0.3342 | Yes | ||
| 4 | UGT1A1 | Ugt1a1 | 1240 | 0.748 | 0.3719 | Yes | ||
| 5 | BLVRB | Blvrb | 1686 | 0.624 | 0.4060 | Yes | ||
| 6 | ALAD | Alad | 2147 | 0.513 | 0.4279 | Yes | ||
| 7 | UROS | Uros | 2478 | 0.465 | 0.4534 | Yes | ||
| 8 | EPRS1 | Eprs | 2485 | 0.463 | 0.4996 | Yes | ||
| 9 | FTH1 | Fth1 | 3144 | 0.393 | 0.4967 | No | ||
| 10 | COX10 | Cox10 | 6688 | 0.057 | 0.2739 | No | ||
| 11 | ALAS1 | Alas1 | 6879 | 0.043 | 0.2659 | No | ||
| 12 | HMOX2 | Hmox2 | 7407 | 0.004 | 0.2323 | No | ||
| 13 | FECH | Fech | 8423 | -0.039 | 0.1708 | No | ||
| 14 | PPOX | Ppox | 8562 | -0.049 | 0.1668 | No | ||
| 15 | CP | Cp | 9749 | -0.134 | 0.1038 | No | ||
| 16 | CPOX | Cpox | 10125 | -0.162 | 0.0960 | No | ||
| 17 | UGT1A6 | Ugt1a6a | 10399 | -0.184 | 0.0969 | No | ||
| 18 | BLVRA | Blvra | 10561 | -0.197 | 0.1063 | No | ||
| 19 | UROD | Urod | 10803 | -0.215 | 0.1124 | No | ||
| 20 | HMBS | Hmbs | 11124 | -0.245 | 0.1163 | No | ||
| 21 | HCCS | Hccs | 11233 | -0.256 | 0.1351 | No | ||
| 22 | GUSB | Gusb | 13748 | -0.563 | 0.0295 | No | ||
| 23 | MMAB | Mmab | 14692 | -0.845 | 0.0537 | No |