Fig 1: heat_map
Heat Map of the top 50 features for each phenotype in Placode.placode.phenotype.cls#KOD0_versus_WTD0
Fig 2: Ranked Gene List Correlation Profile
Ranked list correlations for Placode.placode.phenotype.cls#KOD0_versus_WTD0
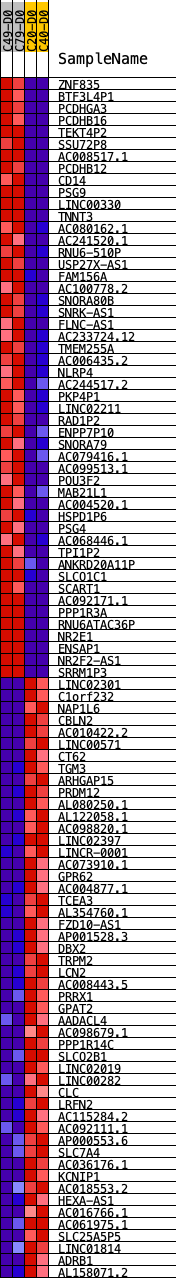 Fig 1: heat_map
 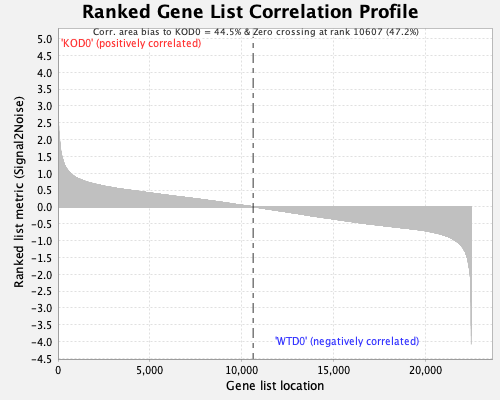 Fig 2: Ranked Gene List Correlation Profile