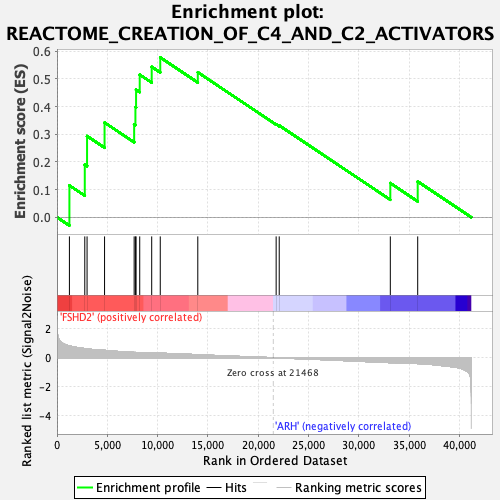
Profile of the Running ES Score & Positions of GeneSet Members on the Rank Ordered List
| Dataset | Normalized.Phenotype.FSHD2.ARH.cls#FSHD2_versus_ARH |
| Phenotype | Phenotype.FSHD2.ARH.cls#FSHD2_versus_ARH |
| Upregulated in class | FSHD2 |
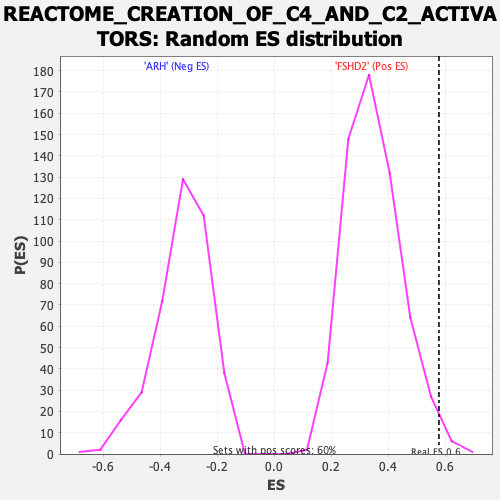
| GeneSet | REACTOME_CREATION_OF_C4_AND_C2_ACTIVATORS |
| Enrichment Score (ES) | 0.57747173 |
| Normalized Enrichment Score (NES) | 1.6693226 |
| Nominal p-value | 0.016638935 |
| FDR q-value | 0.15561283 |
| FWER p-Value | 0.997 |
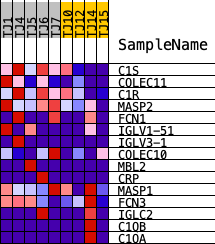
| PROBE | DESCRIPTION (from dataset) | GENE SYMBOL | GENE_TITLE | RANK IN GENE LIST | RANK METRIC SCORE | RUNNING ES | CORE ENRICHMENT | |
|---|---|---|---|---|---|---|---|---|
| 1 | C1S | ENSG00000182326.15 | 1233 | 0.811 | 0.1152 | Yes | ||
| 2 | COLEC11 | ENSG00000118004.17 | 2760 | 0.627 | 0.1903 | Yes | ||
| 3 | C1R | ENSG00000159403.18 | 2987 | 0.607 | 0.2934 | Yes | ||
| 4 | MASP2 | ENSG00000009724.17 | 4725 | 0.509 | 0.3422 | Yes | ||
| 5 | FCN1 | ENSG00000085265.11 | 7665 | 0.364 | 0.3359 | Yes | ||
| 6 | IGLV1-51 | ENSG00000211644.3 | 7791 | 0.363 | 0.3978 | Yes | ||
| 7 | IGLV3-1 | ENSG00000211673.2 | 7856 | 0.362 | 0.4610 | Yes | ||
| 8 | COLEC10 | ENSG00000184374.3 | 8219 | 0.353 | 0.5153 | Yes | ||
| 9 | MBL2 | ENSG00000165471.6 | 9409 | 0.319 | 0.5435 | Yes | ||
| 10 | CRP | ENSG00000132693.12 | 10259 | 0.305 | 0.5775 | Yes | ||
| 11 | MASP1 | ENSG00000127241.16 | 13988 | 0.206 | 0.5237 | No | ||
| 12 | FCN3 | ENSG00000142748.12 | 21773 | -0.008 | 0.3361 | No | ||
| 13 | IGLC2 | ENSG00000211677.2 | 22079 | -0.016 | 0.3315 | No | ||
| 14 | C1QB | ENSG00000173369.16 | 33116 | -0.336 | 0.1235 | No | ||
| 15 | C1QA | ENSG00000173372.17 | 35837 | -0.402 | 0.1294 | No |