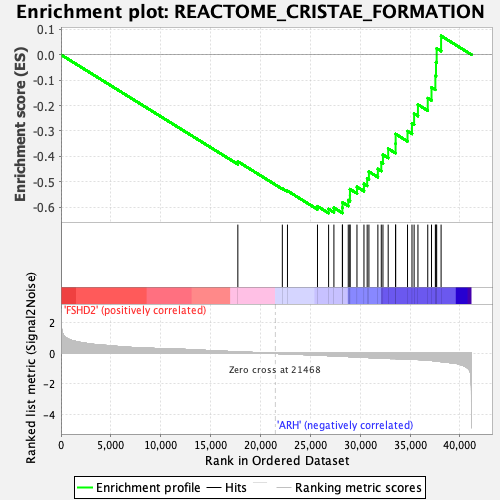
Profile of the Running ES Score & Positions of GeneSet Members on the Rank Ordered List
| Dataset | Normalized.Phenotype.FSHD2.ARH.cls#FSHD2_versus_ARH |
| Phenotype | Phenotype.FSHD2.ARH.cls#FSHD2_versus_ARH |
| Upregulated in class | ARH |
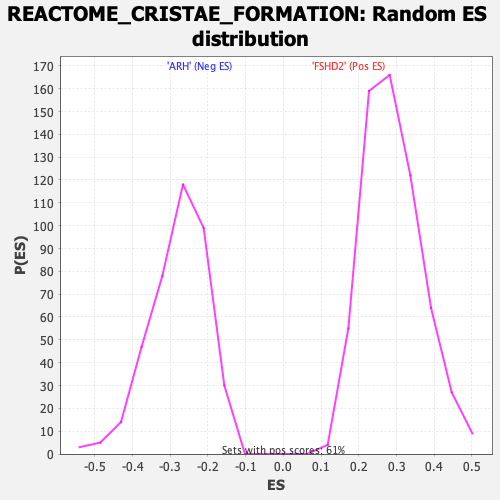
| GeneSet | REACTOME_CRISTAE_FORMATION |
| Enrichment Score (ES) | -0.6233304 |
| Normalized Enrichment Score (NES) | -2.2331307 |
| Nominal p-value | 0.0 |
| FDR q-value | 4.358412E-4 |
| FWER p-Value | 0.011 |
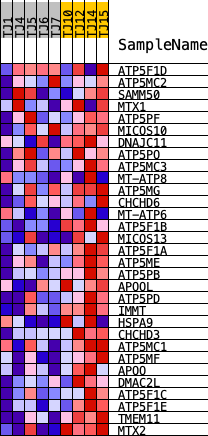
| PROBE | DESCRIPTION (from dataset) | GENE SYMBOL | GENE_TITLE | RANK IN GENE LIST | RANK METRIC SCORE | RUNNING ES | CORE ENRICHMENT | |
|---|---|---|---|---|---|---|---|---|
| 1 | ATP5F1D | ENSG00000099624.8 | 17733 | 0.098 | -0.4201 | No | ||
| 2 | ATP5MC2 | ENSG00000135390.20 | 22194 | -0.018 | -0.5266 | No | ||
| 3 | SAMM50 | ENSG00000100347.15 | 22709 | -0.031 | -0.5356 | No | ||
| 4 | MTX1 | ENSG00000173171.14 | 25719 | -0.112 | -0.5962 | No | ||
| 5 | ATP5PF | ENSG00000154723.12 | 26834 | -0.144 | -0.6072 | Yes | ||
| 6 | MICOS10 | ENSG00000173436.15 | 27366 | -0.160 | -0.6021 | Yes | ||
| 7 | DNAJC11 | ENSG00000007923.16 | 28213 | -0.187 | -0.6018 | Yes | ||
| 8 | ATP5PO | ENSG00000241837.7 | 28230 | -0.187 | -0.5812 | Yes | ||
| 9 | ATP5MC3 | ENSG00000154518.9 | 28805 | -0.205 | -0.5722 | Yes | ||
| 10 | MT-ATP8 | ENSG00000228253.1 | 28975 | -0.211 | -0.5526 | Yes | ||
| 11 | ATP5MG | ENSG00000167283.8 | 28977 | -0.211 | -0.5290 | Yes | ||
| 12 | CHCHD6 | ENSG00000159685.11 | 29678 | -0.233 | -0.5199 | Yes | ||
| 13 | MT-ATP6 | ENSG00000198899.2 | 30379 | -0.256 | -0.5082 | Yes | ||
| 14 | ATP5F1B | ENSG00000110955.9 | 30702 | -0.266 | -0.4863 | Yes | ||
| 15 | MICOS13 | ENSG00000174917.8 | 30876 | -0.273 | -0.4599 | Yes | ||
| 16 | ATP5F1A | ENSG00000152234.16 | 31775 | -0.288 | -0.4495 | Yes | ||
| 17 | ATP5ME | ENSG00000169020.10 | 32116 | -0.301 | -0.4240 | Yes | ||
| 18 | ATP5PB | ENSG00000116459.11 | 32284 | -0.308 | -0.3936 | Yes | ||
| 19 | APOOL | ENSG00000155008.14 | 32809 | -0.328 | -0.3695 | Yes | ||
| 20 | ATP5PD | ENSG00000167863.12 | 33549 | -0.338 | -0.3497 | Yes | ||
| 21 | IMMT | ENSG00000132305.20 | 33557 | -0.338 | -0.3120 | Yes | ||
| 22 | HSPA9 | ENSG00000113013.15 | 34748 | -0.358 | -0.3008 | Yes | ||
| 23 | CHCHD3 | ENSG00000106554.13 | 35195 | -0.374 | -0.2698 | Yes | ||
| 24 | ATP5MC1 | ENSG00000159199.14 | 35409 | -0.384 | -0.2320 | Yes | ||
| 25 | ATP5MF | ENSG00000241468.7 | 35793 | -0.402 | -0.1963 | Yes | ||
| 26 | APOO | ENSG00000184831.14 | 36776 | -0.439 | -0.1710 | Yes | ||
| 27 | DMAC2L | ENSG00000125375.15 | 37153 | -0.461 | -0.1286 | Yes | ||
| 28 | ATP5F1C | ENSG00000165629.20 | 37540 | -0.488 | -0.0833 | Yes | ||
| 29 | ATP5F1E | ENSG00000124172.10 | 37604 | -0.494 | -0.0295 | Yes | ||
| 30 | TMEM11 | ENSG00000178307.9 | 37671 | -0.500 | 0.0248 | Yes | ||
| 31 | MTX2 | ENSG00000128654.14 | 38114 | -0.536 | 0.0741 | Yes |