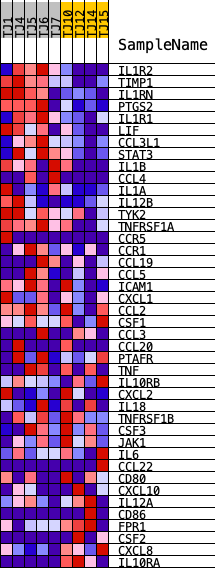
Profile of the Running ES Score & Positions of GeneSet Members on the Rank Ordered List
| Dataset | Normalized.Phenotype.FSHD2.ARH.cls#FSHD2_versus_ARH |
| Phenotype | Phenotype.FSHD2.ARH.cls#FSHD2_versus_ARH |
| Upregulated in class | FSHD2 |
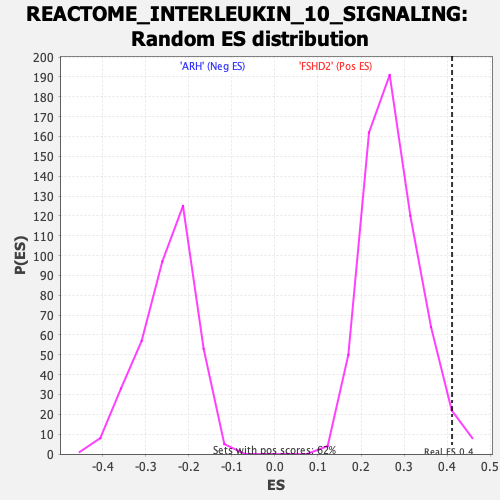
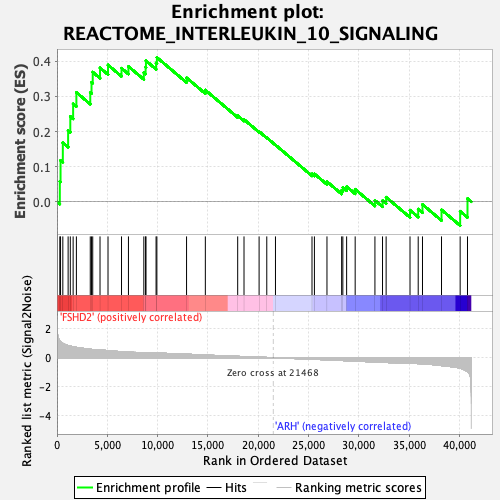
| GeneSet | REACTOME_INTERLEUKIN_10_SIGNALING |
| Enrichment Score (ES) | 0.41123953 |
| Normalized Enrichment Score (NES) | 1.5091332 |
| Nominal p-value | 0.0273752 |
| FDR q-value | 0.23701292 |
| FWER p-Value | 1.0 |
| PROBE | DESCRIPTION (from dataset) | GENE SYMBOL | GENE_TITLE | RANK IN GENE LIST | RANK METRIC SCORE | RUNNING ES | CORE ENRICHMENT | |
|---|---|---|---|---|---|---|---|---|
| 1 | IL1R2 | ENSG00000115590.14 | 280 | 1.147 | 0.0581 | Yes | ||
| 2 | TIMP1 | ENSG00000102265.12 | 352 | 1.090 | 0.1180 | Yes | ||
| 3 | IL1RN | ENSG00000136689.18 | 579 | 0.987 | 0.1684 | Yes | ||
| 4 | PTGS2 | ENSG00000073756.12 | 1105 | 0.837 | 0.2030 | Yes | ||
| 5 | IL1R1 | ENSG00000115594.12 | 1321 | 0.799 | 0.2429 | Yes | ||
| 6 | LIF | ENSG00000128342.5 | 1603 | 0.758 | 0.2790 | Yes | ||
| 7 | CCL3L1 | ENSG00000276085.1 | 1926 | 0.714 | 0.3115 | Yes | ||
| 8 | STAT3 | ENSG00000168610.14 | 3305 | 0.583 | 0.3110 | Yes | ||
| 9 | IL1B | ENSG00000125538.12 | 3430 | 0.572 | 0.3404 | Yes | ||
| 10 | CCL4 | ENSG00000275302.2 | 3550 | 0.564 | 0.3694 | Yes | ||
| 11 | IL1A | ENSG00000115008.5 | 4274 | 0.526 | 0.3816 | Yes | ||
| 12 | IL12B | ENSG00000113302.4 | 5068 | 0.486 | 0.3898 | Yes | ||
| 13 | TYK2 | ENSG00000105397.14 | 6410 | 0.412 | 0.3805 | Yes | ||
| 14 | TNFRSF1A | ENSG00000067182.7 | 7098 | 0.385 | 0.3856 | Yes | ||
| 15 | CCR5 | ENSG00000160791.13 | 8627 | 0.348 | 0.3681 | Yes | ||
| 16 | CCR1 | ENSG00000163823.4 | 8802 | 0.344 | 0.3833 | Yes | ||
| 17 | CCL19 | ENSG00000172724.12 | 8838 | 0.342 | 0.4018 | Yes | ||
| 18 | CCL5 | ENSG00000271503.6 | 9843 | 0.317 | 0.3954 | Yes | ||
| 19 | ICAM1 | ENSG00000090339.9 | 9924 | 0.314 | 0.4112 | Yes | ||
| 20 | CXCL1 | ENSG00000163739.5 | 12872 | 0.242 | 0.3533 | No | ||
| 21 | CCL2 | ENSG00000108691.9 | 14738 | 0.183 | 0.3182 | No | ||
| 22 | CSF1 | ENSG00000184371.14 | 17952 | 0.092 | 0.2453 | No | ||
| 23 | CCL3 | ENSG00000277632.2 | 18580 | 0.077 | 0.2344 | No | ||
| 24 | CCL20 | ENSG00000115009.13 | 20079 | 0.037 | 0.2001 | No | ||
| 25 | PTAFR | ENSG00000169403.12 | 20842 | 0.016 | 0.1825 | No | ||
| 26 | TNF | ENSG00000232810.4 | 21705 | -0.006 | 0.1619 | No | ||
| 27 | IL10RB | ENSG00000243646.10 | 25335 | -0.100 | 0.0793 | No | ||
| 28 | CXCL2 | ENSG00000081041.9 | 25575 | -0.107 | 0.0795 | No | ||
| 29 | IL18 | ENSG00000150782.12 | 26822 | -0.144 | 0.0574 | No | ||
| 30 | TNFRSF1B | ENSG00000028137.19 | 28280 | -0.189 | 0.0326 | No | ||
| 31 | CSF3 | ENSG00000108342.12 | 28399 | -0.193 | 0.0407 | No | ||
| 32 | JAK1 | ENSG00000162434.13 | 28776 | -0.204 | 0.0431 | No | ||
| 33 | IL6 | ENSG00000136244.12 | 29624 | -0.231 | 0.0356 | No | ||
| 34 | CCL22 | ENSG00000102962.5 | 31587 | -0.285 | 0.0040 | No | ||
| 35 | CD80 | ENSG00000121594.12 | 32342 | -0.311 | 0.0033 | No | ||
| 36 | CXCL10 | ENSG00000169245.6 | 32700 | -0.324 | 0.0130 | No | ||
| 37 | IL12A | ENSG00000168811.7 | 35073 | -0.368 | -0.0239 | No | ||
| 38 | CD86 | ENSG00000114013.16 | 35887 | -0.402 | -0.0209 | No | ||
| 39 | FPR1 | ENSG00000171051.8 | 36312 | -0.416 | -0.0077 | No | ||
| 40 | CSF2 | ENSG00000164400.6 | 38203 | -0.543 | -0.0229 | No | ||
| 41 | CXCL8 | ENSG00000169429.11 | 40055 | -0.722 | -0.0271 | No | ||
| 42 | IL10RA | ENSG00000110324.10 | 40784 | -0.953 | 0.0092 | No |