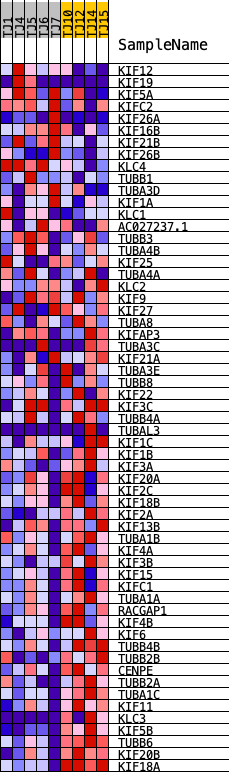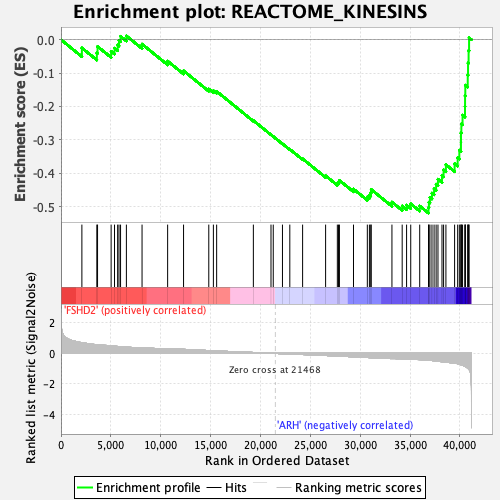
Profile of the Running ES Score & Positions of GeneSet Members on the Rank Ordered List
| Dataset | Normalized.Phenotype.FSHD2.ARH.cls#FSHD2_versus_ARH |
| Phenotype | Phenotype.FSHD2.ARH.cls#FSHD2_versus_ARH |
| Upregulated in class | ARH |
| GeneSet | REACTOME_KINESINS |
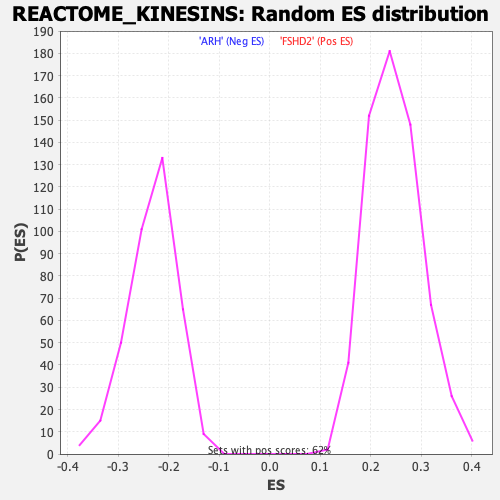
| Enrichment Score (ES) | -0.51974446 |
| Normalized Enrichment Score (NES) | -2.2296946 |
| Nominal p-value | 0.0 |
| FDR q-value | 4.6471576E-4 |
| FWER p-Value | 0.012 |
| PROBE | DESCRIPTION (from dataset) | GENE SYMBOL | GENE_TITLE | RANK IN GENE LIST | RANK METRIC SCORE | RUNNING ES | CORE ENRICHMENT | |
|---|---|---|---|---|---|---|---|---|
| 1 | KIF12 | ENSG00000136883.14 | 2094 | 0.694 | -0.0246 | No | ||
| 2 | KIF19 | ENSG00000196169.15 | 3593 | 0.563 | -0.0398 | No | ||
| 3 | KIF5A | ENSG00000155980.12 | 3665 | 0.560 | -0.0203 | No | ||
| 4 | KIFC2 | ENSG00000167702.12 | 5026 | 0.489 | -0.0348 | No | ||
| 5 | KIF26A | ENSG00000066735.14 | 5366 | 0.467 | -0.0254 | No | ||
| 6 | KIF16B | ENSG00000089177.18 | 5681 | 0.449 | -0.0160 | No | ||
| 7 | KIF21B | ENSG00000116852.14 | 5815 | 0.443 | -0.0024 | No | ||
| 8 | KIF26B | ENSG00000162849.16 | 5972 | 0.435 | 0.0102 | No | ||
| 9 | KLC4 | ENSG00000137171.15 | 6556 | 0.406 | 0.0115 | No | ||
| 10 | TUBB1 | ENSG00000101162.3 | 8127 | 0.356 | -0.0132 | No | ||
| 11 | TUBA3D | ENSG00000075886.11 | 10693 | 0.303 | -0.0642 | No | ||
| 12 | KIF1A | ENSG00000130294.16 | 12289 | 0.261 | -0.0931 | No | ||
| 13 | KLC1 | ENSG00000126214.21 | 14819 | 0.180 | -0.1478 | No | ||
| 14 | AC027237.1 | ENSG00000259191.2 | 15280 | 0.165 | -0.1527 | No | ||
| 15 | TUBB3 | ENSG00000258947.7 | 15608 | 0.156 | -0.1547 | No | ||
| 16 | TUBA4B | ENSG00000243910.8 | 19289 | 0.057 | -0.2421 | No | ||
| 17 | KIF25 | ENSG00000125337.19 | 21057 | 0.010 | -0.2847 | No | ||
| 18 | TUBA4A | ENSG00000127824.14 | 21284 | 0.004 | -0.2901 | No | ||
| 19 | KLC2 | ENSG00000174996.11 | 22207 | -0.018 | -0.3118 | No | ||
| 20 | KIF9 | ENSG00000088727.12 | 22944 | -0.037 | -0.3283 | No | ||
| 21 | KIF27 | ENSG00000165115.15 | 24228 | -0.071 | -0.3568 | No | ||
| 22 | TUBA8 | ENSG00000183785.15 | 26534 | -0.136 | -0.4077 | No | ||
| 23 | KIFAP3 | ENSG00000075945.13 | 27710 | -0.171 | -0.4299 | No | ||
| 24 | TUBA3C | ENSG00000198033.12 | 27829 | -0.175 | -0.4261 | No | ||
| 25 | KIF21A | ENSG00000139116.18 | 27919 | -0.177 | -0.4216 | No | ||
| 26 | TUBA3E | ENSG00000152086.9 | 29330 | -0.222 | -0.4474 | No | ||
| 27 | TUBB8 | ENSG00000261456.5 | 30717 | -0.267 | -0.4711 | No | ||
| 28 | KIF22 | ENSG00000079616.12 | 30925 | -0.274 | -0.4657 | No | ||
| 29 | KIF3C | ENSG00000084731.15 | 31061 | -0.279 | -0.4584 | No | ||
| 30 | TUBB4A | ENSG00000104833.12 | 31106 | -0.281 | -0.4488 | No | ||
| 31 | TUBAL3 | ENSG00000178462.12 | 33185 | -0.336 | -0.4866 | No | ||
| 32 | KIF1C | ENSG00000129250.12 | 34212 | -0.350 | -0.4983 | No | ||
| 33 | KIF1B | ENSG00000054523.17 | 34654 | -0.354 | -0.4956 | No | ||
| 34 | KIF3A | ENSG00000131437.15 | 35070 | -0.368 | -0.4918 | No | ||
| 35 | KIF20A | ENSG00000112984.12 | 35970 | -0.404 | -0.4983 | No | ||
| 36 | KIF2C | ENSG00000142945.13 | 36852 | -0.443 | -0.5030 | Yes | ||
| 37 | KIF18B | ENSG00000186185.14 | 36892 | -0.446 | -0.4870 | Yes | ||
| 38 | KIF2A | ENSG00000068796.16 | 36994 | -0.452 | -0.4723 | Yes | ||
| 39 | KIF13B | ENSG00000197892.13 | 37199 | -0.463 | -0.4597 | Yes | ||
| 40 | TUBA1B | ENSG00000123416.15 | 37411 | -0.478 | -0.4467 | Yes | ||
| 41 | KIF4A | ENSG00000090889.12 | 37615 | -0.495 | -0.4329 | Yes | ||
| 42 | KIF3B | ENSG00000101350.8 | 37801 | -0.512 | -0.4180 | Yes | ||
| 43 | KIF15 | ENSG00000163808.17 | 38204 | -0.543 | -0.4072 | Yes | ||
| 44 | KIFC1 | ENSG00000237649.8 | 38364 | -0.556 | -0.3900 | Yes | ||
| 45 | TUBA1A | ENSG00000167552.14 | 38598 | -0.561 | -0.3744 | Yes | ||
| 46 | RACGAP1 | ENSG00000161800.13 | 39469 | -0.633 | -0.3716 | Yes | ||
| 47 | KIF4B | ENSG00000226650.6 | 39776 | -0.670 | -0.3536 | Yes | ||
| 48 | KIF6 | ENSG00000164627.18 | 39943 | -0.703 | -0.3310 | Yes | ||
| 49 | TUBB4B | ENSG00000188229.6 | 40106 | -0.733 | -0.3072 | Yes | ||
| 50 | TUBB2B | ENSG00000137285.10 | 40109 | -0.733 | -0.2794 | Yes | ||
| 51 | CENPE | ENSG00000138778.12 | 40145 | -0.740 | -0.2522 | Yes | ||
| 52 | TUBB2A | ENSG00000137267.6 | 40266 | -0.768 | -0.2260 | Yes | ||
| 53 | TUBA1C | ENSG00000167553.15 | 40512 | -0.843 | -0.2000 | Yes | ||
| 54 | KIF11 | ENSG00000138160.6 | 40519 | -0.845 | -0.1681 | Yes | ||
| 55 | KLC3 | ENSG00000104892.17 | 40542 | -0.855 | -0.1362 | Yes | ||
| 56 | KIF5B | ENSG00000170759.11 | 40785 | -0.954 | -0.1059 | Yes | ||
| 57 | TUBB6 | ENSG00000176014.13 | 40817 | -0.979 | -0.0696 | Yes | ||
| 58 | KIF20B | ENSG00000138182.14 | 40873 | -1.017 | -0.0324 | Yes | ||
| 59 | KIF18A | ENSG00000121621.7 | 40921 | -1.038 | 0.0058 | Yes |