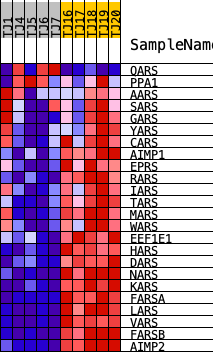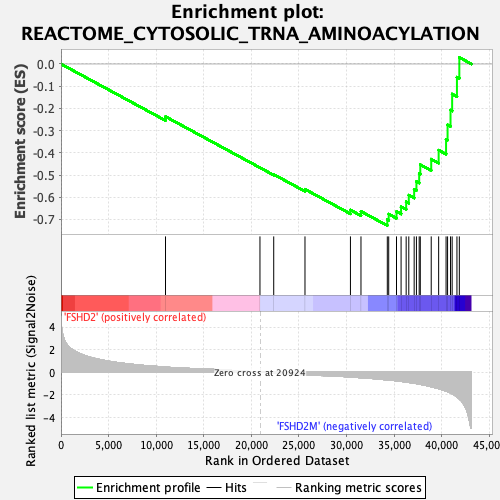
Profile of the Running ES Score & Positions of GeneSet Members on the Rank Ordered List
| Dataset | Normalized.Phenotype.FSHD2.FSHD2M.cls#FSHD2_versus_FSHD2M |
| Phenotype | Phenotype.FSHD2.FSHD2M.cls#FSHD2_versus_FSHD2M |
| Upregulated in class | FSHD2M |
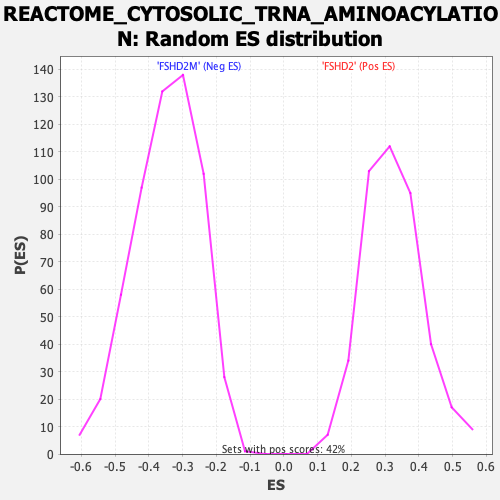
| GeneSet | REACTOME_CYTOSOLIC_TRNA_AMINOACYLATION |
| Enrichment Score (ES) | -0.72784245 |
| Normalized Enrichment Score (NES) | -2.0954752 |
| Nominal p-value | 0.0 |
| FDR q-value | 2.9998278E-4 |
| FWER p-Value | 0.006 |
| PROBE | DESCRIPTION (from dataset) | GENE SYMBOL | GENE_TITLE | RANK IN GENE LIST | RANK METRIC SCORE | RUNNING ES | CORE ENRICHMENT | |
|---|---|---|---|---|---|---|---|---|
| 1 | QARS | ENSG00000172053.18 | 10978 | 0.446 | -0.2369 | No | ||
| 2 | PPA1 | ENSG00000180817.12 | 20900 | 0.002 | -0.4670 | No | ||
| 3 | AARS | ENSG00000090861.15 | 22345 | -0.077 | -0.4974 | No | ||
| 4 | SARS | ENSG00000031698.13 | 25629 | -0.235 | -0.5641 | No | ||
| 5 | GARS | ENSG00000106105.14 | 30404 | -0.432 | -0.6576 | No | ||
| 6 | YARS | ENSG00000134684.10 | 31511 | -0.489 | -0.6637 | No | ||
| 7 | CARS | ENSG00000110619.17 | 34277 | -0.681 | -0.7006 | Yes | ||
| 8 | AIMP1 | ENSG00000164022.17 | 34424 | -0.695 | -0.6761 | Yes | ||
| 9 | EPRS | ENSG00000136628.18 | 35243 | -0.763 | -0.6645 | Yes | ||
| 10 | RARS | ENSG00000113643.9 | 35724 | -0.811 | -0.6431 | Yes | ||
| 11 | IARS | ENSG00000196305.17 | 36258 | -0.873 | -0.6205 | Yes | ||
| 12 | TARS | ENSG00000113407.13 | 36534 | -0.904 | -0.5907 | Yes | ||
| 13 | MARS | ENSG00000166986.15 | 37098 | -0.980 | -0.5645 | Yes | ||
| 14 | WARS | ENSG00000140105.18 | 37336 | -1.011 | -0.5294 | Yes | ||
| 15 | EEF1E1 | ENSG00000124802.12 | 37626 | -1.054 | -0.4939 | Yes | ||
| 16 | HARS | ENSG00000170445.15 | 37742 | -1.075 | -0.4535 | Yes | ||
| 17 | DARS | ENSG00000115866.11 | 38890 | -1.287 | -0.4286 | Yes | ||
| 18 | NARS | ENSG00000134440.12 | 39671 | -1.460 | -0.3882 | Yes | ||
| 19 | KARS | ENSG00000065427.14 | 40450 | -1.672 | -0.3392 | Yes | ||
| 20 | FARSA | ENSG00000179115.11 | 40608 | -1.720 | -0.2739 | Yes | ||
| 21 | LARS | ENSG00000133706.18 | 40918 | -1.831 | -0.2077 | Yes | ||
| 22 | VARS | ENSG00000204394.13 | 41089 | -1.905 | -0.1354 | Yes | ||
| 23 | FARSB | ENSG00000116120.11 | 41592 | -2.189 | -0.0593 | Yes | ||
| 24 | AIMP2 | ENSG00000106305.10 | 41843 | -2.363 | 0.0296 | Yes |