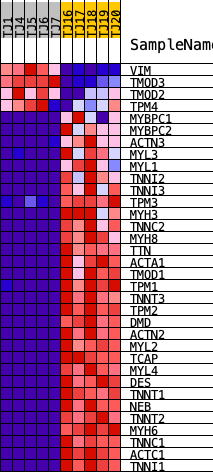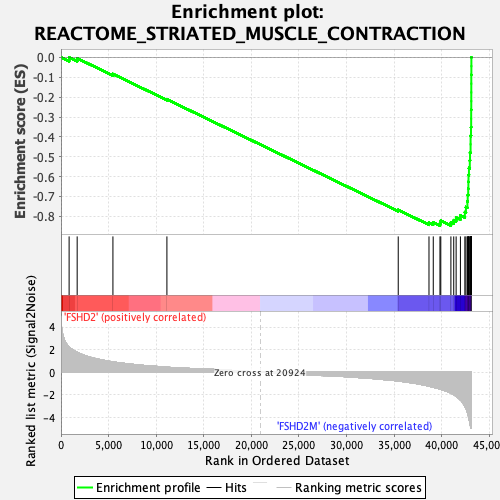
Profile of the Running ES Score & Positions of GeneSet Members on the Rank Ordered List
| Dataset | Normalized.Phenotype.FSHD2.FSHD2M.cls#FSHD2_versus_FSHD2M |
| Phenotype | Phenotype.FSHD2.FSHD2M.cls#FSHD2_versus_FSHD2M |
| Upregulated in class | FSHD2M |
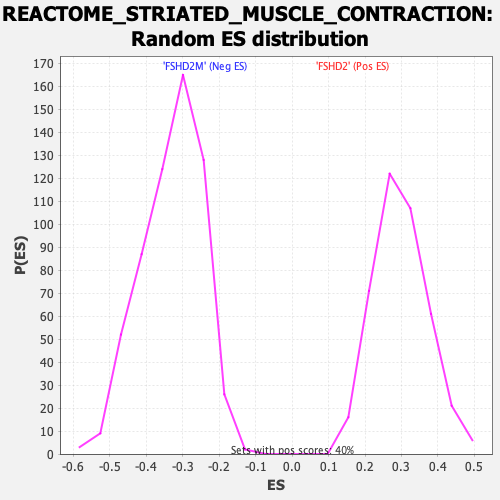
| GeneSet | REACTOME_STRIATED_MUSCLE_CONTRACTION |
| Enrichment Score (ES) | -0.8469066 |
| Normalized Enrichment Score (NES) | -2.5734074 |
| Nominal p-value | 0.0 |
| FDR q-value | 0.0 |
| FWER p-Value | 0.0 |
| PROBE | DESCRIPTION (from dataset) | GENE SYMBOL | GENE_TITLE | RANK IN GENE LIST | RANK METRIC SCORE | RUNNING ES | CORE ENRICHMENT | |
|---|---|---|---|---|---|---|---|---|
| 1 | VIM | ENSG00000026025.16 | 852 | 2.214 | -0.0001 | No | ||
| 2 | TMOD3 | ENSG00000138594.14 | 1698 | 1.756 | -0.0041 | No | ||
| 3 | TMOD2 | ENSG00000128872.10 | 5454 | 0.906 | -0.0832 | No | ||
| 4 | TPM4 | ENSG00000167460.17 | 11125 | 0.437 | -0.2110 | No | ||
| 5 | MYBPC1 | ENSG00000196091.14 | 35425 | -0.780 | -0.7680 | No | ||
| 6 | MYBPC2 | ENSG00000086967.10 | 38655 | -1.234 | -0.8320 | No | ||
| 7 | ACTN3 | ENSG00000248746.6 | 39105 | -1.332 | -0.8306 | No | ||
| 8 | MYL3 | ENSG00000160808.10 | 39809 | -1.495 | -0.8336 | Yes | ||
| 9 | MYL1 | ENSG00000168530.16 | 39896 | -1.521 | -0.8221 | Yes | ||
| 10 | TNNI2 | ENSG00000130598.16 | 40957 | -1.846 | -0.8303 | Yes | ||
| 11 | TNNI3 | ENSG00000129991.13 | 41255 | -1.980 | -0.8197 | Yes | ||
| 12 | TPM3 | ENSG00000143549.21 | 41507 | -2.135 | -0.8065 | Yes | ||
| 13 | MYH3 | ENSG00000109063.15 | 41957 | -2.460 | -0.7951 | Yes | ||
| 14 | TNNC2 | ENSG00000101470.10 | 42424 | -3.025 | -0.7791 | Yes | ||
| 15 | MYH8 | ENSG00000133020.4 | 42537 | -3.185 | -0.7534 | Yes | ||
| 16 | TTN | ENSG00000155657.26 | 42690 | -3.572 | -0.7252 | Yes | ||
| 17 | ACTA1 | ENSG00000143632.14 | 42721 | -3.653 | -0.6935 | Yes | ||
| 18 | TMOD1 | ENSG00000136842.14 | 42776 | -3.811 | -0.6609 | Yes | ||
| 19 | TPM1 | ENSG00000140416.21 | 42794 | -3.877 | -0.6269 | Yes | ||
| 20 | TNNT3 | ENSG00000130595.19 | 42808 | -3.940 | -0.5922 | Yes | ||
| 21 | TPM2 | ENSG00000198467.15 | 42854 | -4.136 | -0.5565 | Yes | ||
| 22 | DMD | ENSG00000198947.15 | 42943 | -4.488 | -0.5187 | Yes | ||
| 23 | ACTN2 | ENSG00000077522.13 | 42966 | -4.553 | -0.4788 | Yes | ||
| 24 | MYL2 | ENSG00000111245.15 | 43025 | -4.822 | -0.4374 | Yes | ||
| 25 | TCAP | ENSG00000173991.5 | 43026 | -4.827 | -0.3945 | Yes | ||
| 26 | MYL4 | ENSG00000198336.9 | 43070 | -4.932 | -0.3517 | Yes | ||
| 27 | DES | ENSG00000175084.12 | 43086 | -4.954 | -0.3081 | Yes | ||
| 28 | TNNT1 | ENSG00000105048.17 | 43087 | -4.955 | -0.2641 | Yes | ||
| 29 | NEB | ENSG00000183091.19 | 43097 | -4.966 | -0.2202 | Yes | ||
| 30 | TNNT2 | ENSG00000118194.20 | 43098 | -4.967 | -0.1761 | Yes | ||
| 31 | MYH6 | ENSG00000197616.12 | 43099 | -4.967 | -0.1320 | Yes | ||
| 32 | TNNC1 | ENSG00000114854.8 | 43100 | -4.968 | -0.0879 | Yes | ||
| 33 | ACTC1 | ENSG00000159251.8 | 43108 | -4.973 | -0.0439 | Yes | ||
| 34 | TNNI1 | ENSG00000159173.19 | 43109 | -4.974 | 0.0002 | Yes |