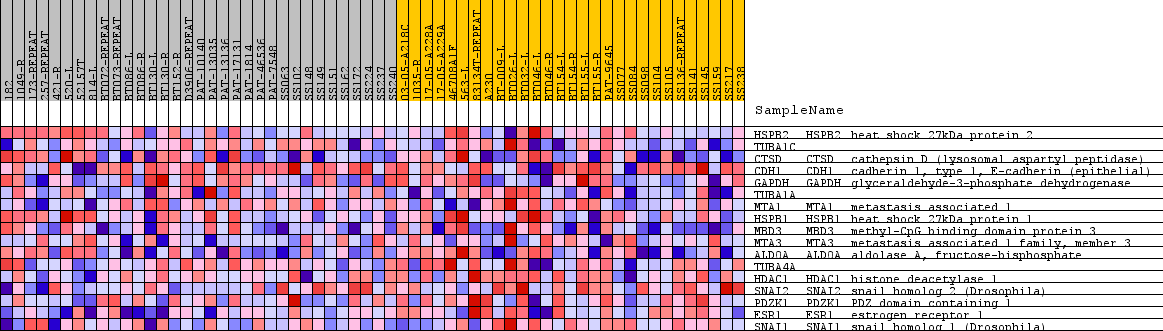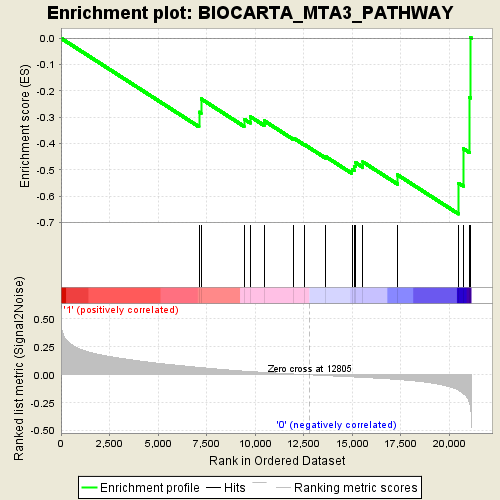
Profile of the Running ES Score & Positions of GeneSet Members on the Rank Ordered List
| Dataset | NOV0093_collapsed_to_symbols.NOV0093.cls #obese_versus_normal.NOV0093.cls #obese_versus_normal_repos |
| Phenotype | NOV0093.cls#obese_versus_normal_repos |
| Upregulated in class | 0 |
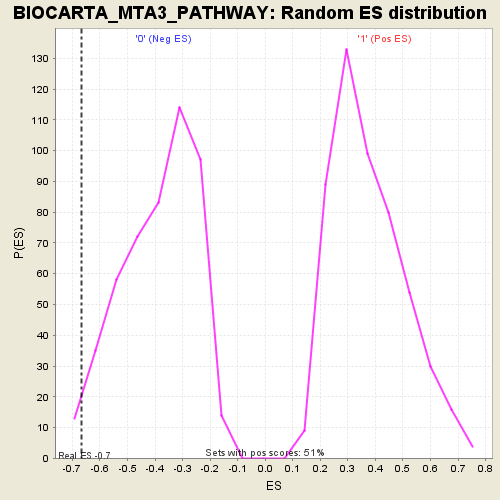
| GeneSet | BIOCARTA_MTA3_PATHWAY |
| Enrichment Score (ES) | -0.6673899 |
| Normalized Enrichment Score (NES) | -1.7299597 |
| Nominal p-value | 0.020576132 |
| FDR q-value | 1.0 |
| FWER p-Value | 0.991 |
| PROBE | GENE SYMBOL | GENE_TITLE | RANK IN GENE LIST | RANK METRIC SCORE | RUNNING ES | CORE ENRICHMENT | |
|---|---|---|---|---|---|---|---|
| 1 | HSPB2 | HSPB2 Entrez, Source | heat shock 27kDa protein 2 | 7107 | 0.066 | -0.2800 | No |
| 2 | TUBA1C | 7213 | 0.064 | -0.2300 | No | ||
| 3 | CTSD | CTSD Entrez, Source | cathepsin D (lysosomal aspartyl peptidase) | 9429 | 0.032 | -0.3071 | No |
| 4 | CDH1 | CDH1 Entrez, Source | cadherin 1, type 1, E-cadherin (epithelial) | 9744 | 0.029 | -0.2974 | No |
| 5 | GAPDH | GAPDH Entrez, Source | glyceraldehyde-3-phosphate dehydrogenase | 10463 | 0.021 | -0.3132 | No |
| 6 | TUBA1A | 11999 | 0.007 | -0.3800 | No | ||
| 7 | MTA1 | MTA1 Entrez, Source | metastasis associated 1 | 12561 | 0.002 | -0.4048 | No |
| 8 | HSPB1 | HSPB1 Entrez, Source | heat shock 27kDa protein 1 | 13623 | -0.007 | -0.4489 | No |
| 9 | MBD3 | MBD3 Entrez, Source | methyl-CpG binding domain protein 3 | 14989 | -0.019 | -0.4976 | No |
| 10 | MTA3 | MTA3 Entrez, Source | metastasis associated 1 family, member 3 | 15111 | -0.020 | -0.4865 | No |
| 11 | ALDOA | ALDOA Entrez, Source | aldolase A, fructose-bisphosphate | 15160 | -0.020 | -0.4715 | No |
| 12 | TUBA4A | 15549 | -0.024 | -0.4696 | No | ||
| 13 | HDAC1 | HDAC1 Entrez, Source | histone deacetylase 1 | 17331 | -0.041 | -0.5184 | No |
| 14 | SNAI2 | SNAI2 Entrez, Source | snail homolog 2 (Drosophila) | 20480 | -0.137 | -0.5501 | Yes |
| 15 | PDZK1 | PDZK1 Entrez, Source | PDZ domain containing 1 | 20720 | -0.166 | -0.4189 | Yes |
| 16 | ESR1 | ESR1 Entrez, Source | estrogen receptor 1 | 21036 | -0.244 | -0.2250 | Yes |
| 17 | SNAI1 | SNAI1 Entrez, Source | snail homolog 1 (Drosophila) | 21082 | -0.268 | 0.0029 | Yes |