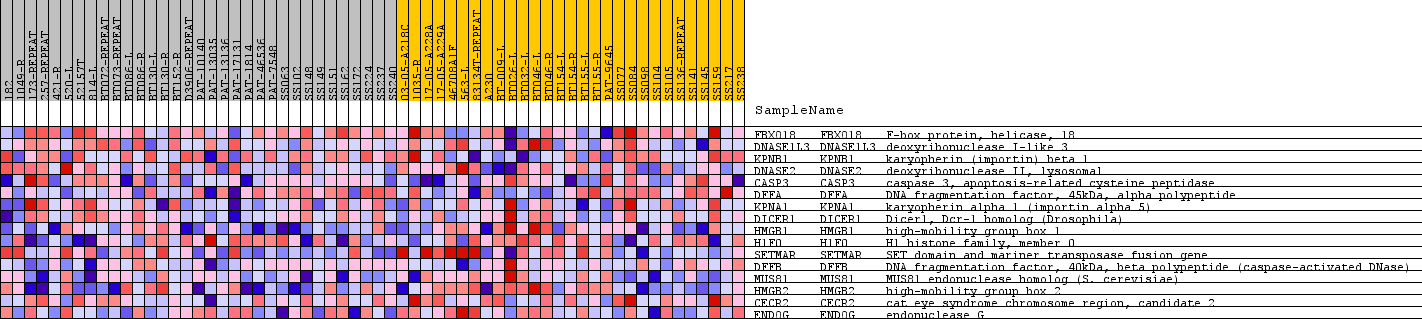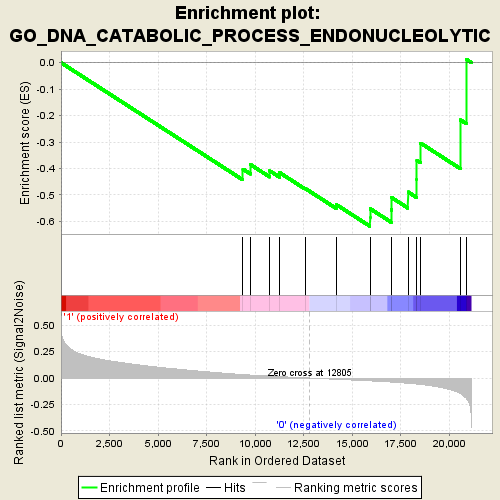
Profile of the Running ES Score & Positions of GeneSet Members on the Rank Ordered List
| Dataset | NOV0093_collapsed_to_symbols.NOV0093.cls #obese_versus_normal.NOV0093.cls #obese_versus_normal_repos |
| Phenotype | NOV0093.cls#obese_versus_normal_repos |
| Upregulated in class | 0 |
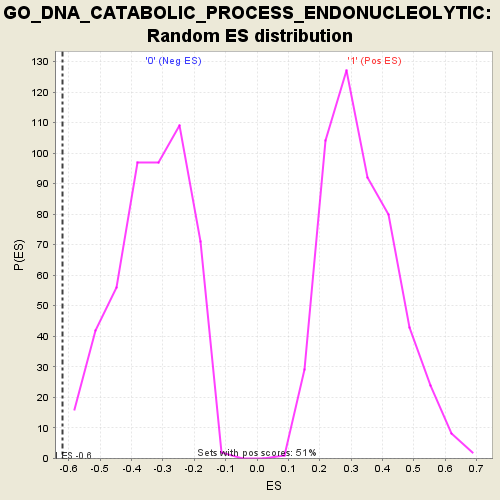
| GeneSet | GO_DNA_CATABOLIC_PROCESS_ENDONUCLEOLYTIC |
| Enrichment Score (ES) | -0.6186796 |
| Normalized Enrichment Score (NES) | -1.8594346 |
| Nominal p-value | 0.0 |
| FDR q-value | 0.49724466 |
| FWER p-Value | 0.86 |
| PROBE | GENE SYMBOL | GENE_TITLE | RANK IN GENE LIST | RANK METRIC SCORE | RUNNING ES | CORE ENRICHMENT | |
|---|---|---|---|---|---|---|---|
| 1 | FBXO18 | FBXO18 Entrez, Source | F-box protein, helicase, 18 | 9371 | 0.033 | -0.4025 | No |
| 2 | DNASE1L3 | DNASE1L3 Entrez, Source | deoxyribonuclease I-like 3 | 9764 | 0.029 | -0.3855 | No |
| 3 | KPNB1 | KPNB1 Entrez, Source | karyopherin (importin) beta 1 | 10753 | 0.019 | -0.4092 | No |
| 4 | DNASE2 | DNASE2 Entrez, Source | deoxyribonuclease II, lysosomal | 11255 | 0.014 | -0.4155 | No |
| 5 | CASP3 | CASP3 Entrez, Source | caspase 3, apoptosis-related cysteine peptidase | 12572 | 0.002 | -0.4753 | No |
| 6 | DFFA | DFFA Entrez, Source | DNA fragmentation factor, 45kDa, alpha polypeptide | 14175 | -0.012 | -0.5363 | No |
| 7 | KPNA1 | KPNA1 Entrez, Source | karyopherin alpha 1 (importin alpha 5) | 15916 | -0.027 | -0.5852 | Yes |
| 8 | DICER1 | DICER1 Entrez, Source | Dicer1, Dcr-1 homolog (Drosophila) | 15920 | -0.027 | -0.5519 | Yes |
| 9 | HMGB1 | HMGB1 Entrez, Source | high-mobility group box 1 | 17008 | -0.038 | -0.5564 | Yes |
| 10 | H1F0 | H1F0 Entrez, Source | H1 histone family, member 0 | 17030 | -0.038 | -0.5101 | Yes |
| 11 | SETMAR | SETMAR Entrez, Source | SET domain and mariner transposase fusion gene | 17874 | -0.049 | -0.4889 | Yes |
| 12 | DFFB | DFFB Entrez, Source | DNA fragmentation factor, 40kDa, beta polypeptide (caspase-activated DNase) | 18329 | -0.056 | -0.4402 | Yes |
| 13 | MUS81 | MUS81 Entrez, Source | MUS81 endonuclease homolog (S. cerevisiae) | 18334 | -0.056 | -0.3701 | Yes |
| 14 | HMGB2 | HMGB2 Entrez, Source | high-mobility group box 2 | 18526 | -0.060 | -0.3041 | Yes |
| 15 | CECR2 | CECR2 Entrez, Source | cat eye syndrome chromosome region, candidate 2 | 20576 | -0.148 | -0.2164 | Yes |
| 16 | ENDOG | ENDOG Entrez, Source | endonuclease G | 20896 | -0.195 | 0.0117 | Yes |