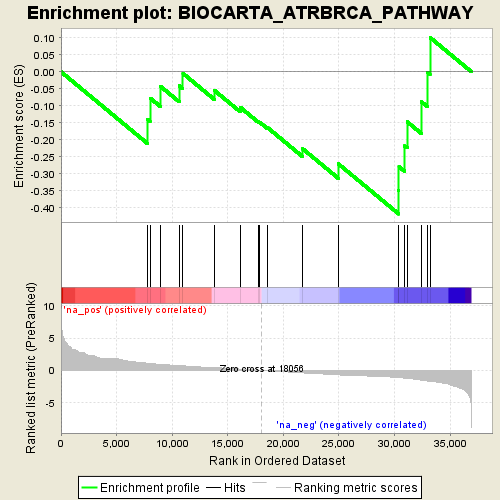
Profile of the Running ES Score & Positions of GeneSet Members on the Rank Ordered List
| Dataset | NOV0135_D11_log2foldchange_preranked |
| Phenotype | NoPhenotypeAvailable |
| Upregulated in class | na_neg |
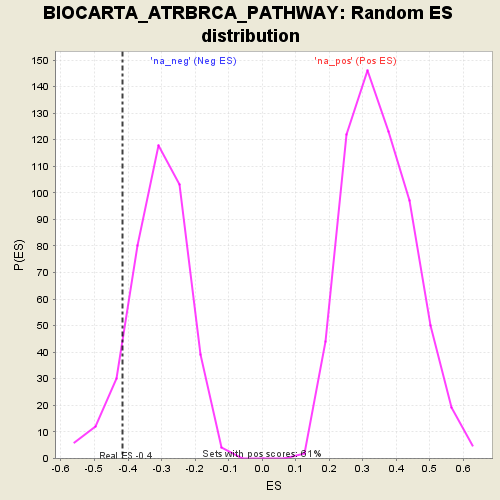
| GeneSet | BIOCARTA_ATRBRCA_PATHWAY |
| Enrichment Score (ES) | -0.4177101 |
| Normalized Enrichment Score (NES) | -1.341917 |
| Nominal p-value | 0.10204082 |
| FDR q-value | 1.0 |
| FWER p-Value | 1.0 |
| PROBE | GENE SYMBOL | GENE_TITLE | RANK IN GENE LIST | RANK METRIC SCORE | RUNNING ES | CORE ENRICHMENT | |
|---|---|---|---|---|---|---|---|
| 1 | FANCG | 7748 | 1.131 | -0.1385 | No | ||
| 2 | TP53 | 8005 | 1.086 | -0.0769 | No | ||
| 3 | FANCE | 8916 | 0.946 | -0.0418 | No | ||
| 4 | FANCC | 10630 | 0.749 | -0.0409 | No | ||
| 5 | RAD51 | 10966 | 0.718 | -0.0047 | No | ||
| 6 | RAD9A | 13797 | 0.424 | -0.0546 | No | ||
| 7 | HUS1 | 16116 | 0.213 | -0.1040 | No | ||
| 8 | CHEK2 | 17781 | 0.032 | -0.1471 | No | ||
| 9 | RAD1 | 17873 | 0.022 | -0.1482 | No | ||
| 10 | FANCF | 18569 | -0.053 | -0.1637 | No | ||
| 11 | FANCD2 | 21750 | -0.371 | -0.2264 | No | ||
| 12 | CHEK1 | 24930 | -0.676 | -0.2699 | No | ||
| 13 | RAD17 | 30386 | -1.103 | -0.3481 | Yes | ||
| 14 | BRCA1 | 30400 | -1.106 | -0.2787 | Yes | ||
| 15 | ATR | 30914 | -1.185 | -0.2177 | Yes | ||
| 16 | NBN | 31134 | -1.219 | -0.1467 | Yes | ||
| 17 | ATM | 32403 | -1.483 | -0.0875 | Yes | ||
| 18 | BRCA2 | 32978 | -1.620 | -0.0008 | Yes | ||
| 19 | RAD50 | 33195 | -1.705 | 0.1010 | Yes |