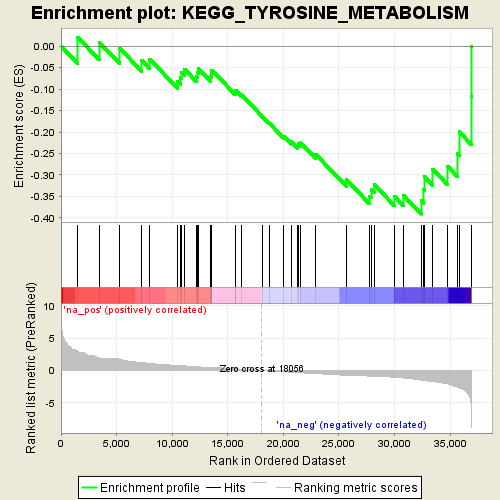
Profile of the Running ES Score & Positions of GeneSet Members on the Rank Ordered List
| Dataset | NOV0135_D11_log2foldchange_preranked |
| Phenotype | NoPhenotypeAvailable |
| Upregulated in class | na_neg |
| GeneSet | KEGG_TYROSINE_METABOLISM |
| Enrichment Score (ES) | -0.3912906 |
| Normalized Enrichment Score (NES) | -1.5309587 |
| Nominal p-value | 0.0056980057 |
| FDR q-value | 1.0 |
| FWER p-Value | 0.999 |
| PROBE | GENE SYMBOL | GENE_TITLE | RANK IN GENE LIST | RANK METRIC SCORE | RUNNING ES | CORE ENRICHMENT | |
|---|---|---|---|---|---|---|---|
| 1 | COMT | 1514 | 2.953 | 0.0206 | No | ||
| 2 | FAH | 3426 | 1.958 | 0.0097 | No | ||
| 3 | HPD | 5256 | 1.718 | -0.0040 | No | ||
| 4 | ADH7 | 7265 | 1.202 | -0.0334 | No | ||
| 5 | GOT2 | 7982 | 1.091 | -0.0300 | No | ||
| 6 | ALDH3B1 | 10509 | 0.764 | -0.0826 | No | ||
| 7 | GSTZ1 | 10720 | 0.737 | -0.0729 | No | ||
| 8 | LCMT1 | 10842 | 0.734 | -0.0608 | No | ||
| 9 | ALDH3A1 | 11139 | 0.696 | -0.0543 | No | ||
| 10 | PNMT | 12201 | 0.575 | -0.0711 | No | ||
| 11 | LCMT2 | 12248 | 0.571 | -0.0604 | No | ||
| 12 | GOT1 | 12361 | 0.556 | -0.0518 | No | ||
| 13 | NAT6 | 13442 | 0.465 | -0.0714 | No | ||
| 14 | IL4I1 | 13493 | 0.458 | -0.0632 | No | ||
| 15 | METTL2B | 13555 | 0.452 | -0.0554 | No | ||
| 16 | TYRP1 | 15688 | 0.257 | -0.1079 | No | ||
| 17 | ADH5 | 15723 | 0.253 | -0.1035 | No | ||
| 18 | HEMK1 | 16195 | 0.204 | -0.1120 | No | ||
| 19 | MIF | 18125 | -0.008 | -0.1642 | No | ||
| 20 | MAOB | 18733 | -0.071 | -0.1791 | No | ||
| 21 | METTL6 | 20025 | -0.197 | -0.2100 | No | ||
| 22 | DBH | 20694 | -0.260 | -0.2227 | No | ||
| 23 | HGD | 21298 | -0.319 | -0.2324 | No | ||
| 24 | TYR | 21364 | -0.325 | -0.2274 | No | ||
| 25 | AOX1 | 21564 | -0.349 | -0.2255 | No | ||
| 26 | ADH1A | 22882 | -0.473 | -0.2514 | No | ||
| 27 | TAT | 25654 | -0.757 | -0.3107 | No | ||
| 28 | TPO | 27758 | -0.873 | -0.3495 | No | ||
| 29 | AOC3 | 27915 | -0.893 | -0.3351 | No | ||
| 30 | ADH4 | 28173 | -0.928 | -0.3227 | No | ||
| 31 | MAOA | 30001 | -1.054 | -0.3502 | No | ||
| 32 | AOC2 | 30775 | -1.159 | -0.3470 | No | ||
| 33 | TH | 32411 | -1.485 | -0.3603 | Yes | ||
| 34 | TRMT11 | 32618 | -1.532 | -0.3339 | Yes | ||
| 35 | ADH6 | 32685 | -1.549 | -0.3033 | Yes | ||
| 36 | ADH1C | 33454 | -1.768 | -0.2872 | Yes | ||
| 37 | ADH1B | 34776 | -2.059 | -0.2801 | Yes | ||
| 38 | ALDH1A3 | 35665 | -2.548 | -0.2510 | Yes | ||
| 39 | DDC | 35823 | -2.652 | -0.1998 | Yes | ||
| 40 | DCT | 36896 | -5.362 | -0.1170 | Yes | ||
| 41 | ALDH3B2 | 36908 | -5.634 | 0.0004 | Yes |
