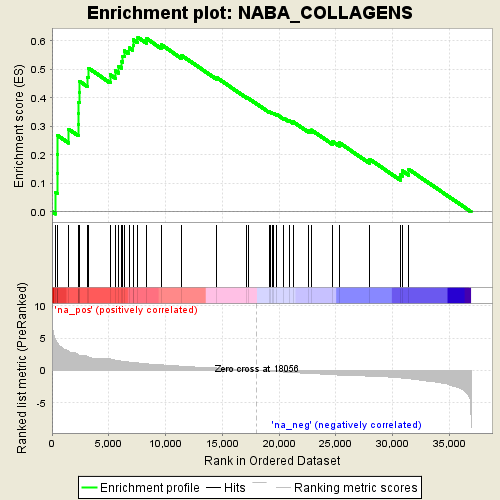
Profile of the Running ES Score & Positions of GeneSet Members on the Rank Ordered List
| Dataset | NOV0135_D11_log2foldchange_preranked |
| Phenotype | NoPhenotypeAvailable |
| Upregulated in class | na_pos |
| GeneSet | NABA_COLLAGENS |
| Enrichment Score (ES) | 0.6119422 |
| Normalized Enrichment Score (NES) | 2.1457908 |
| Nominal p-value | 0.0 |
| FDR q-value | 0.0010856254 |
| FWER p-Value | 0.006 |
| PROBE | GENE SYMBOL | GENE_TITLE | RANK IN GENE LIST | RANK METRIC SCORE | RUNNING ES | CORE ENRICHMENT | |
|---|---|---|---|---|---|---|---|
| 1 | COL8A1 | 290 | 4.756 | 0.0686 | Yes | ||
| 2 | COL3A1 | 444 | 4.306 | 0.1337 | Yes | ||
| 3 | COL5A3 | 469 | 4.243 | 0.2013 | Yes | ||
| 4 | COL12A1 | 502 | 4.180 | 0.2676 | Yes | ||
| 5 | COL5A1 | 1472 | 3.013 | 0.2898 | Yes | ||
| 6 | COL21A1 | 2309 | 2.471 | 0.3068 | Yes | ||
| 7 | COL1A2 | 2328 | 2.443 | 0.3456 | Yes | ||
| 8 | COL6A3 | 2337 | 2.421 | 0.3843 | Yes | ||
| 9 | COL6A2 | 2413 | 2.363 | 0.4203 | Yes | ||
| 10 | COL15A1 | 2422 | 2.359 | 0.4580 | Yes | ||
| 11 | COL1A1 | 3148 | 2.121 | 0.4724 | Yes | ||
| 12 | COL18A1 | 3225 | 2.080 | 0.5038 | Yes | ||
| 13 | COL4A1 | 5119 | 1.780 | 0.4811 | Yes | ||
| 14 | COL4A2 | 5574 | 1.601 | 0.4945 | Yes | ||
| 15 | COL8A2 | 5853 | 1.522 | 0.5115 | Yes | ||
| 16 | COL20A1 | 6151 | 1.431 | 0.5264 | Yes | ||
| 17 | COL6A1 | 6238 | 1.407 | 0.5467 | Yes | ||
| 18 | COL10A1 | 6360 | 1.372 | 0.5655 | Yes | ||
| 19 | COL23A1 | 6778 | 1.303 | 0.5751 | Yes | ||
| 20 | COL13A1 | 7131 | 1.227 | 0.5853 | Yes | ||
| 21 | COL11A2 | 7169 | 1.218 | 0.6039 | Yes | ||
| 22 | COL26A1 | 7565 | 1.167 | 0.6119 | Yes | ||
| 23 | COL4A3 | 8325 | 1.035 | 0.6080 | No | ||
| 24 | COL16A1 | 9608 | 0.855 | 0.5870 | No | ||
| 25 | COL6A5 | 11382 | 0.669 | 0.5497 | No | ||
| 26 | COL25A1 | 14525 | 0.378 | 0.4705 | No | ||
| 27 | COL27A1 | 17169 | 0.099 | 0.4005 | No | ||
| 28 | COL11A1 | 17329 | 0.081 | 0.3975 | No | ||
| 29 | COL24A1 | 19120 | -0.106 | 0.3506 | No | ||
| 30 | COL6A6 | 19212 | -0.116 | 0.3500 | No | ||
| 31 | COL4A6 | 19436 | -0.138 | 0.3462 | No | ||
| 32 | COL9A3 | 19536 | -0.150 | 0.3459 | No | ||
| 33 | COL7A1 | 19797 | -0.178 | 0.3417 | No | ||
| 34 | COL17A1 | 20406 | -0.234 | 0.3290 | No | ||
| 35 | COL4A4 | 20885 | -0.282 | 0.3206 | No | ||
| 36 | COL2A1 | 21231 | -0.315 | 0.3163 | No | ||
| 37 | COL9A1 | 22587 | -0.443 | 0.2866 | No | ||
| 38 | COL4A5 | 22847 | -0.469 | 0.2872 | No | ||
| 39 | COL5A2 | 24734 | -0.655 | 0.2466 | No | ||
| 40 | COL14A1 | 25319 | -0.719 | 0.2423 | No | ||
| 41 | COL9A2 | 27990 | -0.903 | 0.1844 | No | ||
| 42 | COL28A1 | 30689 | -1.145 | 0.1296 | No | ||
| 43 | COL22A1 | 30847 | -1.174 | 0.1443 | No | ||
| 44 | COL19A1 | 31443 | -1.271 | 0.1486 | No |