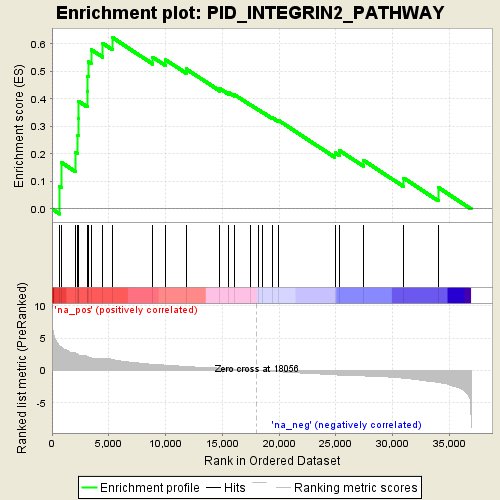
Profile of the Running ES Score & Positions of GeneSet Members on the Rank Ordered List
| Dataset | NOV0135_D11_log2foldchange_preranked |
| Phenotype | NoPhenotypeAvailable |
| Upregulated in class | na_pos |
| GeneSet | PID_INTEGRIN2_PATHWAY |
| Enrichment Score (ES) | 0.62297857 |
| Normalized Enrichment Score (NES) | 1.9814343 |
| Nominal p-value | 0.0 |
| FDR q-value | 0.0064645284 |
| FWER p-Value | 0.1 |
| PROBE | GENE SYMBOL | GENE_TITLE | RANK IN GENE LIST | RANK METRIC SCORE | RUNNING ES | CORE ENRICHMENT | |
|---|---|---|---|---|---|---|---|
| 1 | ICAM2 | 674 | 3.821 | 0.0811 | Yes | ||
| 2 | ICAM1 | 835 | 3.538 | 0.1687 | Yes | ||
| 3 | ITGB2 | 2080 | 2.704 | 0.2053 | Yes | ||
| 4 | SPON2 | 2260 | 2.525 | 0.2661 | Yes | ||
| 5 | TGFBI | 2290 | 2.481 | 0.3299 | Yes | ||
| 6 | PLAU | 2348 | 2.409 | 0.3909 | Yes | ||
| 7 | C3 | 3093 | 2.181 | 0.4275 | Yes | ||
| 8 | ITGAX | 3120 | 2.147 | 0.4826 | Yes | ||
| 9 | ITGAM | 3202 | 2.096 | 0.5349 | Yes | ||
| 10 | PLAT | 3435 | 1.953 | 0.5794 | Yes | ||
| 11 | ITGAD | 4471 | 1.927 | 0.6014 | Yes | ||
| 12 | THY1 | 5307 | 1.699 | 0.6230 | Yes | ||
| 13 | CYR61 | 8871 | 0.955 | 0.5512 | No | ||
| 14 | F10 | 10025 | 0.818 | 0.5413 | No | ||
| 15 | JAM3 | 11809 | 0.617 | 0.5090 | No | ||
| 16 | PLAUR | 14791 | 0.347 | 0.4372 | No | ||
| 17 | FGB | 15581 | 0.266 | 0.4227 | No | ||
| 18 | FGG | 16048 | 0.221 | 0.4158 | No | ||
| 19 | VCAM1 | 17475 | 0.066 | 0.3789 | No | ||
| 20 | ICAM3 | 18194 | -0.013 | 0.3598 | No | ||
| 21 | FGA | 18548 | -0.050 | 0.3515 | No | ||
| 22 | F11R | 19383 | -0.132 | 0.3323 | No | ||
| 23 | PROC | 19967 | -0.191 | 0.3215 | No | ||
| 24 | ITGAL | 24932 | -0.676 | 0.2045 | No | ||
| 25 | GP1BA | 25332 | -0.719 | 0.2124 | No | ||
| 26 | CD40LG | 27469 | -0.838 | 0.1763 | No | ||
| 27 | FCGR2A | 30981 | -1.197 | 0.1123 | No | ||
| 28 | KNG1 | 34028 | -1.874 | 0.0784 | No |
