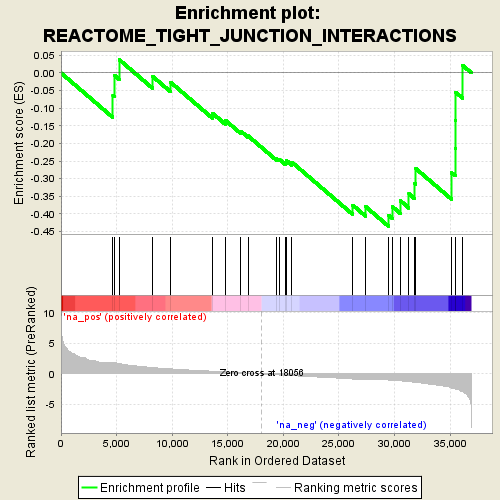
Profile of the Running ES Score & Positions of GeneSet Members on the Rank Ordered List
| Dataset | NOV0135_D11_log2foldchange_preranked |
| Phenotype | NoPhenotypeAvailable |
| Upregulated in class | na_neg |
| GeneSet | REACTOME_TIGHT_JUNCTION_INTERACTIONS |
| Enrichment Score (ES) | -0.4349088 |
| Normalized Enrichment Score (NES) | -1.4908788 |
| Nominal p-value | 0.045333333 |
| FDR q-value | 1.0 |
| FWER p-Value | 1.0 |
| PROBE | GENE SYMBOL | GENE_TITLE | RANK IN GENE LIST | RANK METRIC SCORE | RUNNING ES | CORE ENRICHMENT | |
|---|---|---|---|---|---|---|---|
| 1 | CLDN14 | 4666 | 1.927 | -0.0641 | No | ||
| 2 | CLDN5 | 4815 | 1.894 | -0.0069 | No | ||
| 3 | CLDN11 | 5230 | 1.731 | 0.0379 | No | ||
| 4 | PARD6A | 8246 | 1.048 | -0.0099 | No | ||
| 5 | PARD6G | 9848 | 0.839 | -0.0262 | No | ||
| 6 | CLDN6 | 13649 | 0.441 | -0.1149 | No | ||
| 7 | CLDN2 | 14764 | 0.349 | -0.1338 | No | ||
| 8 | CLDN19 | 16159 | 0.208 | -0.1648 | No | ||
| 9 | PARD3 | 16828 | 0.137 | -0.1785 | No | ||
| 10 | F11R | 19383 | -0.132 | -0.2435 | No | ||
| 11 | CLDN20 | 19605 | -0.157 | -0.2444 | No | ||
| 12 | CLDN18 | 20219 | -0.214 | -0.2541 | No | ||
| 13 | CLDN10 | 20283 | -0.219 | -0.2487 | No | ||
| 14 | CLDN15 | 20763 | -0.268 | -0.2530 | No | ||
| 15 | CLDN3 | 26232 | -0.821 | -0.3746 | No | ||
| 16 | CLDN17 | 27393 | -0.838 | -0.3789 | No | ||
| 17 | PRKCI | 29459 | -0.985 | -0.4030 | Yes | ||
| 18 | MPP5 | 29808 | -1.028 | -0.3792 | Yes | ||
| 19 | CLDN12 | 30515 | -1.122 | -0.3621 | Yes | ||
| 20 | CLDN1 | 31296 | -1.244 | -0.3430 | Yes | ||
| 21 | CLDN16 | 31832 | -1.358 | -0.3135 | Yes | ||
| 22 | PARD6B | 31923 | -1.378 | -0.2714 | Yes | ||
| 23 | CLDN9 | 35123 | -2.328 | -0.2828 | Yes | ||
| 24 | CRB3 | 35456 | -2.424 | -0.2133 | Yes | ||
| 25 | CLDN7 | 35495 | -2.461 | -0.1348 | Yes | ||
| 26 | CLDN4 | 35520 | -2.485 | -0.0550 | Yes | ||
| 27 | CLDN8 | 36125 | -2.874 | 0.0216 | Yes |
