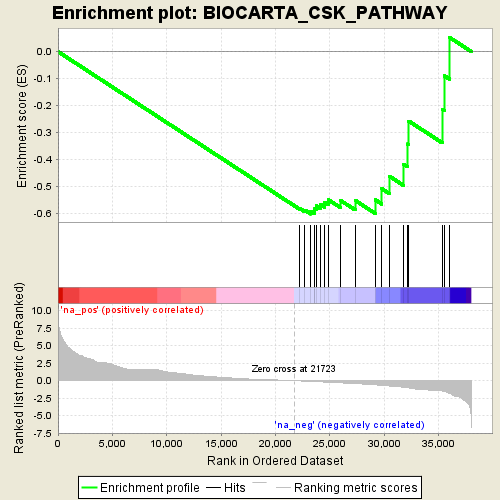
Profile of the Running ES Score & Positions of GeneSet Members on the Rank Ordered List
| Dataset | NOV0135_D3.1_log2foldchange_preranked |
| Phenotype | NoPhenotypeAvailable |
| Upregulated in class | na_neg |
| GeneSet | BIOCARTA_CSK_PATHWAY |
| Enrichment Score (ES) | -0.60252136 |
| Normalized Enrichment Score (NES) | -2.0203767 |
| Nominal p-value | 0.0053475937 |
| FDR q-value | 0.25864115 |
| FWER p-Value | 0.066 |
| PROBE | GENE SYMBOL | GENE_TITLE | RANK IN GENE LIST | RANK METRIC SCORE | RUNNING ES | CORE ENRICHMENT | |
|---|---|---|---|---|---|---|---|
| 1 | PRKAR2A | 22239 | -0.037 | -0.5820 | No | ||
| 2 | HLA-DRB1 | 22710 | -0.070 | -0.5884 | No | ||
| 3 | PRKAR2B | 23249 | -0.107 | -0.5934 | Yes | ||
| 4 | PRKAR1A | 23563 | -0.132 | -0.5905 | Yes | ||
| 5 | CREBBP | 23633 | -0.136 | -0.5808 | Yes | ||
| 6 | GNAS | 23762 | -0.145 | -0.5719 | Yes | ||
| 7 | GNB1 | 24159 | -0.176 | -0.5674 | Yes | ||
| 8 | ZAP70 | 24548 | -0.205 | -0.5603 | Yes | ||
| 9 | CSK | 24868 | -0.229 | -0.5492 | Yes | ||
| 10 | PRKACB | 25993 | -0.315 | -0.5522 | Yes | ||
| 11 | PRKAR1B | 27340 | -0.422 | -0.5518 | Yes | ||
| 12 | LCK | 29183 | -0.599 | -0.5496 | Yes | ||
| 13 | CD247 | 29798 | -0.675 | -0.5086 | Yes | ||
| 14 | HLA-DRA | 30481 | -0.762 | -0.4620 | Yes | ||
| 15 | ADCY1 | 31793 | -0.930 | -0.4177 | Yes | ||
| 16 | GNGT1 | 32183 | -1.008 | -0.3426 | Yes | ||
| 17 | CD4 | 32277 | -1.032 | -0.2577 | Yes | ||
| 18 | PTPRC | 35358 | -1.473 | -0.2140 | Yes | ||
| 19 | CD3G | 35530 | -1.528 | -0.0891 | Yes | ||
| 20 | CD3D | 36029 | -1.828 | 0.0526 | Yes |
