Profile of the Running ES Score & Positions of GeneSet Members on the Rank Ordered List
| Dataset | NOV0135_D3_log2foldchange_preranked |
| Phenotype | NoPhenotypeAvailable |
| Upregulated in class | na_neg |
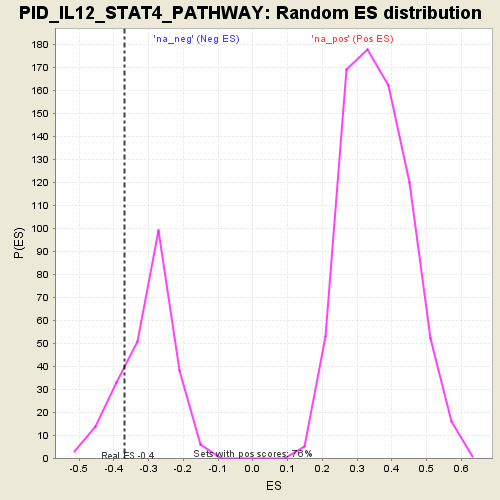
| GeneSet | PID_IL12_STAT4_PATHWAY |
| Enrichment Score (ES) | -0.36923906 |
| Normalized Enrichment Score (NES) | -1.2331859 |
| Nominal p-value | 0.18032786 |
| FDR q-value | 1.0 |
| FWER p-Value | 1.0 |
| PROBE | GENE SYMBOL | GENE_TITLE | RANK IN GENE LIST | RANK METRIC SCORE | RUNNING ES | CORE ENRICHMENT | |
|---|---|---|---|---|---|---|---|
| 1 | FOS | 1371 | 3.651 | 0.0487 | No | ||
| 2 | CD28 | 1533 | 3.368 | 0.1237 | No | ||
| 3 | CD3D | 1800 | 3.358 | 0.1956 | No | ||
| 4 | IL13 | 1804 | 3.358 | 0.2747 | No | ||
| 5 | JUN | 6507 | 1.766 | 0.1880 | No | ||
| 6 | TGFB1 | 6977 | 1.523 | 0.2111 | No | ||
| 7 | IL18R1 | 8328 | 1.201 | 0.2025 | No | ||
| 8 | PRF1 | 8851 | 1.062 | 0.2133 | No | ||
| 9 | ETV5 | 9894 | 0.859 | 0.2051 | No | ||
| 10 | PPP3R1 | 12102 | 0.550 | 0.1579 | No | ||
| 11 | CD247 | 13050 | 0.439 | 0.1424 | No | ||
| 12 | IRF1 | 13482 | 0.395 | 0.1399 | No | ||
| 13 | PPP3CA | 17274 | 0.171 | 0.0405 | No | ||
| 14 | MAPK9 | 17506 | 0.151 | 0.0377 | No | ||
| 15 | CREBBP | 18224 | 0.103 | 0.0206 | No | ||
| 16 | PIAS2 | 18765 | 0.068 | 0.0075 | No | ||
| 17 | MAPK8 | 21912 | -0.159 | -0.0747 | No | ||
| 18 | PPP3CB | 22105 | -0.174 | -0.0758 | No | ||
| 19 | HLA-DRB1 | 22642 | -0.219 | -0.0853 | No | ||
| 20 | STAT4 | 24288 | -0.342 | -0.1221 | No | ||
| 21 | STAT3 | 25083 | -0.416 | -0.1340 | No | ||
| 22 | HLA-DRA | 33702 | -1.595 | -0.3316 | Yes | ||
| 23 | CD86 | 33807 | -1.654 | -0.2955 | Yes | ||
| 24 | IL18 | 34118 | -1.766 | -0.2623 | Yes | ||
| 25 | IL2RA | 34690 | -2.094 | -0.2285 | Yes | ||
| 26 | CD4 | 35400 | -2.255 | -0.1947 | Yes | ||
| 27 | CD3G | 35808 | -2.687 | -0.1424 | Yes | ||
| 28 | TBX21 | 36193 | -3.107 | -0.0797 | Yes | ||
| 29 | CD80 | 36529 | -3.917 | 0.0035 | Yes |