Profile of the Running ES Score & Positions of GeneSet Members on the Rank Ordered List
| Dataset | NOV0135_D3_log2foldchange_preranked |
| Phenotype | NoPhenotypeAvailable |
| Upregulated in class | na_neg |
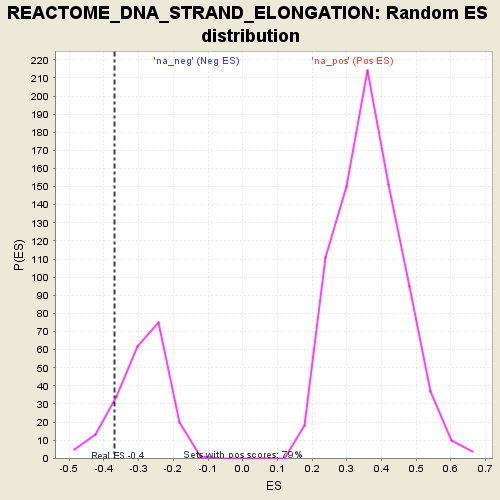
| GeneSet | REACTOME_DNA_STRAND_ELONGATION |
| Enrichment Score (ES) | -0.3694149 |
| Normalized Enrichment Score (NES) | -1.2670478 |
| Nominal p-value | 0.13809524 |
| FDR q-value | 1.0 |
| FWER p-Value | 1.0 |
| PROBE | GENE SYMBOL | GENE_TITLE | RANK IN GENE LIST | RANK METRIC SCORE | RUNNING ES | CORE ENRICHMENT | |
|---|---|---|---|---|---|---|---|
| 1 | RFC3 | 12307 | 0.523 | -0.2738 | No | ||
| 2 | GINS4 | 14886 | 0.334 | -0.3044 | No | ||
| 3 | POLA1 | 15399 | 0.324 | -0.2798 | No | ||
| 4 | MCM8 | 15954 | 0.291 | -0.2604 | No | ||
| 5 | PRIM2 | 17898 | 0.125 | -0.2985 | No | ||
| 6 | PCNA | 18799 | 0.066 | -0.3153 | No | ||
| 7 | MCM7 | 19211 | 0.036 | -0.3223 | No | ||
| 8 | FEN1 | 19700 | 0.004 | -0.3351 | No | ||
| 9 | GINS1 | 20236 | -0.043 | -0.3447 | No | ||
| 10 | RPA1 | 21144 | -0.103 | -0.3571 | Yes | ||
| 11 | RFC2 | 21219 | -0.110 | -0.3461 | Yes | ||
| 12 | MCM4 | 21385 | -0.122 | -0.3361 | Yes | ||
| 13 | RFC4 | 21499 | -0.130 | -0.3237 | Yes | ||
| 14 | RPA3 | 21761 | -0.148 | -0.3132 | Yes | ||
| 15 | RPA2 | 22284 | -0.187 | -0.3053 | Yes | ||
| 16 | POLD2 | 22293 | -0.187 | -0.2832 | Yes | ||
| 17 | MCM3 | 22385 | -0.194 | -0.2626 | Yes | ||
| 18 | RFC5 | 22479 | -0.202 | -0.2410 | Yes | ||
| 19 | DNA2 | 22564 | -0.211 | -0.2183 | Yes | ||
| 20 | MCM5 | 23007 | -0.245 | -0.2012 | Yes | ||
| 21 | CDC45 | 24246 | -0.339 | -0.1947 | Yes | ||
| 22 | MCM6 | 24299 | -0.343 | -0.1553 | Yes | ||
| 23 | POLD3 | 24553 | -0.369 | -0.1184 | Yes | ||
| 24 | PRIM1 | 24843 | -0.398 | -0.0790 | Yes | ||
| 25 | MCM2 | 25605 | -0.469 | -0.0439 | Yes | ||
| 26 | POLA2 | 25609 | -0.470 | 0.0118 | Yes | ||
| 27 | POLD1 | 25788 | -0.492 | 0.0655 | Yes | ||
| 28 | GINS2 | 26000 | -0.515 | 0.1210 | Yes | ||
| 29 | LIG1 | 26215 | -0.540 | 0.1794 | Yes | ||
| 30 | POLD4 | 29213 | -0.889 | 0.2033 | Yes |