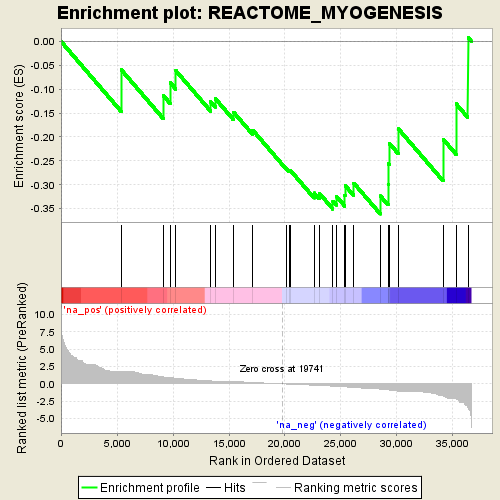
Profile of the Running ES Score & Positions of GeneSet Members on the Rank Ordered List
| Dataset | NOV0135_D3_log2foldchange_preranked |
| Phenotype | NoPhenotypeAvailable |
| Upregulated in class | na_neg |
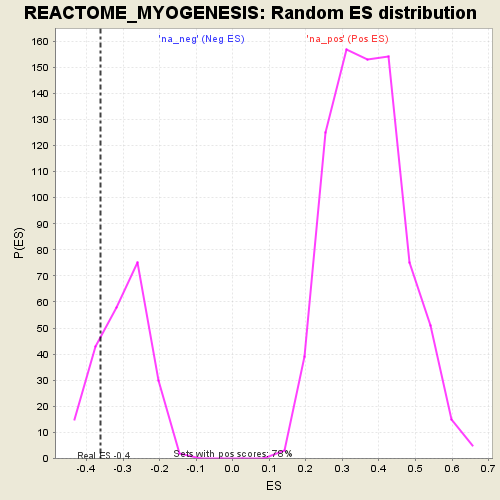
| GeneSet | REACTOME_MYOGENESIS |
| Enrichment Score (ES) | -0.36133993 |
| Normalized Enrichment Score (NES) | -1.2030109 |
| Nominal p-value | 0.1838565 |
| FDR q-value | 1.0 |
| FWER p-Value | 1.0 |
| PROBE | GENE SYMBOL | GENE_TITLE | RANK IN GENE LIST | RANK METRIC SCORE | RUNNING ES | CORE ENRICHMENT | |
|---|---|---|---|---|---|---|---|
| 1 | MYOG | 5368 | 1.782 | -0.0590 | No | ||
| 2 | BNIP2 | 9120 | 0.987 | -0.1129 | No | ||
| 3 | MAPK11 | 9739 | 0.894 | -0.0859 | No | ||
| 4 | CDH2 | 10257 | 0.789 | -0.0613 | No | ||
| 5 | CDC42 | 13374 | 0.407 | -0.1264 | No | ||
| 6 | MEF2D | 13777 | 0.363 | -0.1195 | No | ||
| 7 | MYOD1 | 15403 | 0.324 | -0.1480 | No | ||
| 8 | CTNNB1 | 17113 | 0.187 | -0.1855 | No | ||
| 9 | TCF12 | 20153 | -0.036 | -0.2667 | No | ||
| 10 | MAPK14 | 20390 | -0.055 | -0.2704 | No | ||
| 11 | MEF2A | 20455 | -0.059 | -0.2693 | No | ||
| 12 | CTNNA1 | 22601 | -0.215 | -0.3173 | No | ||
| 13 | MAPK12 | 23058 | -0.247 | -0.3176 | No | ||
| 14 | TCF4 | 24283 | -0.342 | -0.3342 | Yes | ||
| 15 | ABL1 | 24592 | -0.373 | -0.3243 | Yes | ||
| 16 | NEO1 | 25350 | -0.446 | -0.3230 | Yes | ||
| 17 | TCF3 | 25369 | -0.447 | -0.3016 | Yes | ||
| 18 | CDH4 | 26139 | -0.532 | -0.2964 | Yes | ||
| 19 | MAP2K6 | 28518 | -0.772 | -0.3234 | Yes | ||
| 20 | MEF2C | 29212 | -0.889 | -0.2987 | Yes | ||
| 21 | MYF6 | 29267 | -0.895 | -0.2562 | Yes | ||
| 22 | CDON | 29309 | -0.904 | -0.2129 | Yes | ||
| 23 | BOC | 30134 | -1.067 | -0.1830 | Yes | ||
| 24 | CDH15 | 34132 | -1.779 | -0.2048 | Yes | ||
| 25 | NTN3 | 35287 | -2.152 | -0.1306 | Yes | ||
| 26 | MYF5 | 36348 | -3.421 | 0.0085 | Yes |