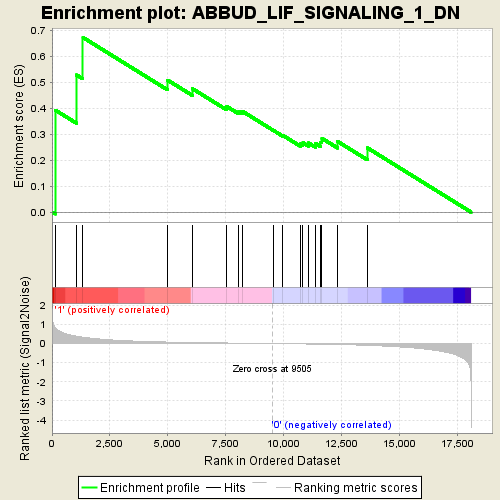
Profile of the Running ES Score & Positions of GeneSet Members on the Rank Ordered List
| Dataset | NS50719_832_collapsed_to_symbols.NS50719_832.cls #arhinia_versus_control.NS50719_832.cls #arhinia_versus_control_repos |
| Phenotype | NS50719_832.cls#arhinia_versus_control_repos |
| Upregulated in class | 1 |
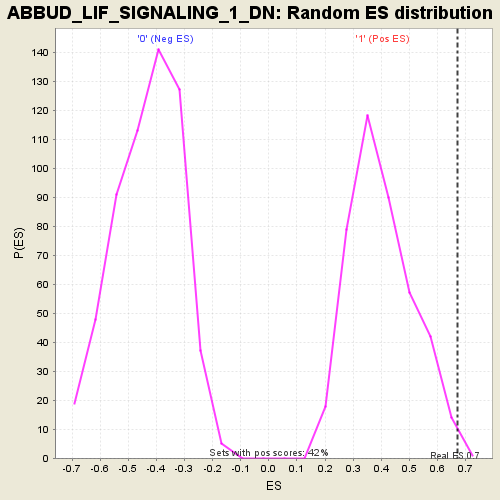
| GeneSet | ABBUD_LIF_SIGNALING_1_DN |
| Enrichment Score (ES) | 0.67294407 |
| Normalized Enrichment Score (NES) | 1.6749877 |
| Nominal p-value | 0.002386635 |
| FDR q-value | 0.9912191 |
| FWER p-Value | 1.0 |
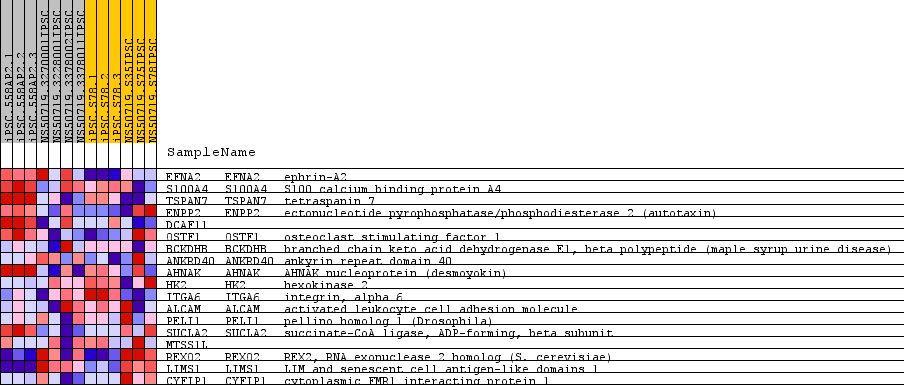
| PROBE | GENE SYMBOL | GENE_TITLE | RANK IN GENE LIST | RANK METRIC SCORE | RUNNING ES | CORE ENRICHMENT | |
|---|---|---|---|---|---|---|---|
| 1 | EFNA2 | EFNA2 Entrez, Source | ephrin-A2 | 132 | 0.829 | 0.3934 | Yes |
| 2 | S100A4 | S100A4 Entrez, Source | S100 calcium binding protein A4 | 1059 | 0.385 | 0.5285 | Yes |
| 3 | TSPAN7 | TSPAN7 Entrez, Source | tetraspanin 7 | 1335 | 0.330 | 0.6729 | Yes |
| 4 | ENPP2 | ENPP2 Entrez, Source | ectonucleotide pyrophosphatase/phosphodiesterase 2 (autotaxin) | 4994 | 0.078 | 0.5085 | No |
| 5 | DCAF11 | 6068 | 0.054 | 0.4754 | No | ||
| 6 | OSTF1 | OSTF1 Entrez, Source | osteoclast stimulating factor 1 | 7549 | 0.028 | 0.4071 | No |
| 7 | BCKDHB | BCKDHB Entrez, Source | branched chain keto acid dehydrogenase E1, beta polypeptide (maple syrup urine disease) | 8067 | 0.020 | 0.3884 | No |
| 8 | ANKRD40 | ANKRD40 Entrez, Source | ankyrin repeat domain 40 | 8236 | 0.018 | 0.3878 | No |
| 9 | AHNAK | AHNAK Entrez, Source | AHNAK nucleoprotein (desmoyokin) | 9551 | -0.001 | 0.3154 | No |
| 10 | HK2 | HK2 Entrez, Source | hexokinase 2 | 9970 | -0.007 | 0.2956 | No |
| 11 | ITGA6 | ITGA6 Entrez, Source | integrin, alpha 6 | 10734 | -0.019 | 0.2629 | No |
| 12 | ALCAM | ALCAM Entrez, Source | activated leukocyte cell adhesion molecule | 10839 | -0.021 | 0.2673 | No |
| 13 | PELI1 | PELI1 Entrez, Source | pellino homolog 1 (Drosophila) | 11075 | -0.025 | 0.2667 | No |
| 14 | SUCLA2 | SUCLA2 Entrez, Source | succinate-CoA ligase, ADP-forming, beta subunit | 11371 | -0.031 | 0.2653 | No |
| 15 | MTSS1L | 11607 | -0.035 | 0.2695 | No | ||
| 16 | REXO2 | REXO2 Entrez, Source | REX2, RNA exonuclease 2 homolog (S. cerevisiae) | 11658 | -0.037 | 0.2843 | No |
| 17 | LIMS1 | LIMS1 Entrez, Source | LIM and senescent cell antigen-like domains 1 | 12337 | -0.052 | 0.2722 | No |
| 18 | CYFIP1 | CYFIP1 Entrez, Source | cytoplasmic FMR1 interacting protein 1 | 13624 | -0.096 | 0.2475 | No |