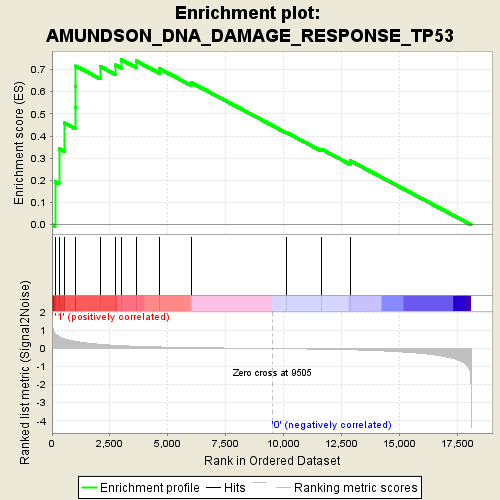
Profile of the Running ES Score & Positions of GeneSet Members on the Rank Ordered List
| Dataset | NS50719_832_collapsed_to_symbols.NS50719_832.cls #arhinia_versus_control.NS50719_832.cls #arhinia_versus_control_repos |
| Phenotype | NS50719_832.cls#arhinia_versus_control_repos |
| Upregulated in class | 1 |
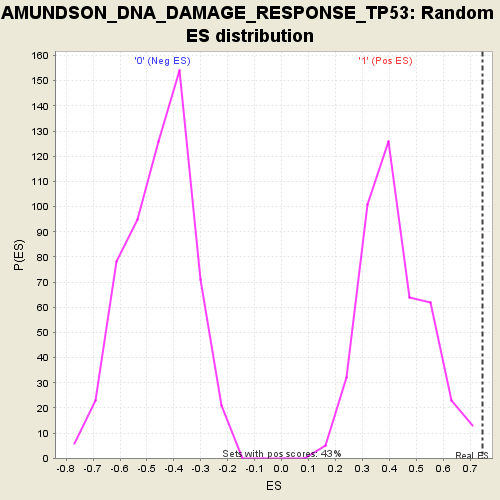
| GeneSet | AMUNDSON_DNA_DAMAGE_RESPONSE_TP53 |
| Enrichment Score (ES) | 0.7444058 |
| Normalized Enrichment Score (NES) | 1.7834748 |
| Nominal p-value | 0.0023474179 |
| FDR q-value | 0.74716115 |
| FWER p-Value | 0.989 |
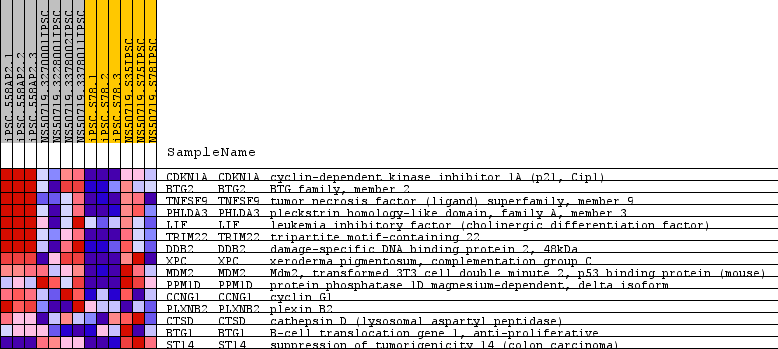
| PROBE | GENE SYMBOL | GENE_TITLE | RANK IN GENE LIST | RANK METRIC SCORE | RUNNING ES | CORE ENRICHMENT | |
|---|---|---|---|---|---|---|---|
| 1 | CDKN1A | CDKN1A Entrez, Source | cyclin-dependent kinase inhibitor 1A (p21, Cip1) | 127 | 0.840 | 0.1934 | Yes |
| 2 | BTG2 | BTG2 Entrez, Source | BTG family, member 2 | 300 | 0.668 | 0.3432 | Yes |
| 3 | TNFSF9 | TNFSF9 Entrez, Source | tumor necrosis factor (ligand) superfamily, member 9 | 529 | 0.538 | 0.4590 | Yes |
| 4 | PHLDA3 | PHLDA3 Entrez, Source | pleckstrin homology-like domain, family A, member 3 | 995 | 0.400 | 0.5288 | Yes |
| 5 | LIF | LIF Entrez, Source | leukemia inhibitory factor (cholinergic differentiation factor) | 1019 | 0.396 | 0.6220 | Yes |
| 6 | TRIM22 | TRIM22 Entrez, Source | tripartite motif-containing 22 | 1028 | 0.394 | 0.7157 | Yes |
| 7 | DDB2 | DDB2 Entrez, Source | damage-specific DNA binding protein 2, 48kDa | 2079 | 0.235 | 0.7138 | Yes |
| 8 | XPC | XPC Entrez, Source | xeroderma pigmentosum, complementation group C | 2729 | 0.178 | 0.7203 | Yes |
| 9 | MDM2 | MDM2 Entrez, Source | Mdm2, transformed 3T3 cell double minute 2, p53 binding protein (mouse) | 2982 | 0.159 | 0.7444 | Yes |
| 10 | PPM1D | PPM1D Entrez, Source | protein phosphatase 1D magnesium-dependent, delta isoform | 3630 | 0.125 | 0.7385 | No |
| 11 | CCNG1 | CCNG1 Entrez, Source | cyclin G1 | 4643 | 0.088 | 0.7035 | No |
| 12 | PLXNB2 | PLXNB2 Entrez, Source | plexin B2 | 6034 | 0.055 | 0.6398 | No |
| 13 | CTSD | CTSD Entrez, Source | cathepsin D (lysosomal aspartyl peptidase) | 10127 | -0.009 | 0.4157 | No |
| 14 | BTG1 | BTG1 Entrez, Source | B-cell translocation gene 1, anti-proliferative | 11627 | -0.036 | 0.3414 | No |
| 15 | ST14 | ST14 Entrez, Source | suppression of tumorigenicity 14 (colon carcinoma) | 12887 | -0.069 | 0.2882 | No |