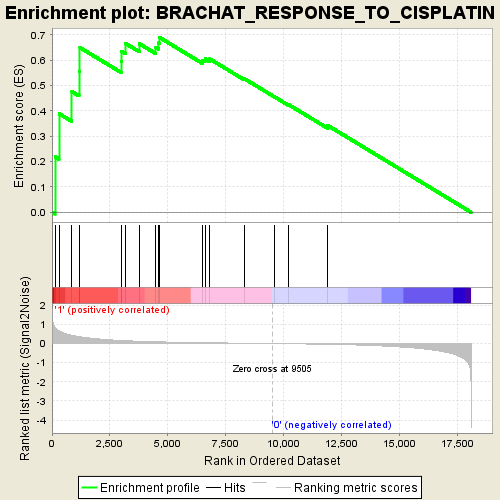
Profile of the Running ES Score & Positions of GeneSet Members on the Rank Ordered List
| Dataset | NS50719_832_collapsed_to_symbols.NS50719_832.cls #arhinia_versus_control.NS50719_832.cls #arhinia_versus_control_repos |
| Phenotype | NS50719_832.cls#arhinia_versus_control_repos |
| Upregulated in class | 1 |
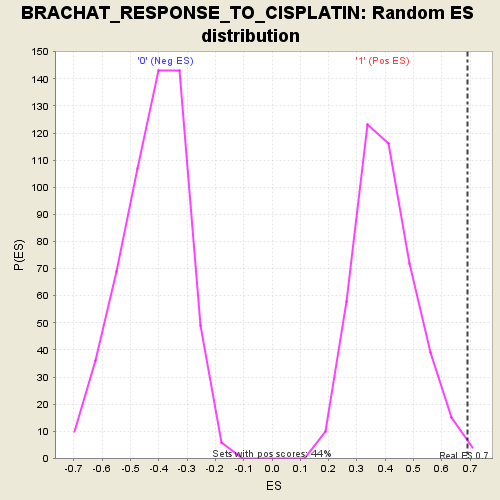
| GeneSet | BRACHAT_RESPONSE_TO_CISPLATIN |
| Enrichment Score (ES) | 0.68952656 |
| Normalized Enrichment Score (NES) | 1.7212796 |
| Nominal p-value | 0.004576659 |
| FDR q-value | 1.0 |
| FWER p-Value | 1.0 |
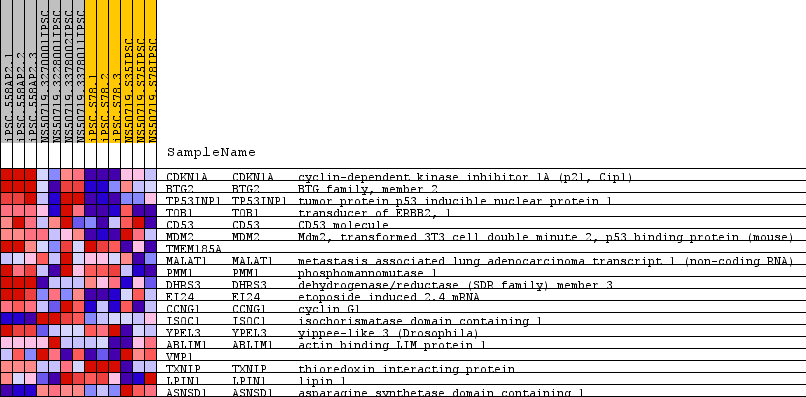
| PROBE | GENE SYMBOL | GENE_TITLE | RANK IN GENE LIST | RANK METRIC SCORE | RUNNING ES | CORE ENRICHMENT | |
|---|---|---|---|---|---|---|---|
| 1 | CDKN1A | CDKN1A Entrez, Source | cyclin-dependent kinase inhibitor 1A (p21, Cip1) | 127 | 0.840 | 0.2190 | Yes |
| 2 | BTG2 | BTG2 Entrez, Source | BTG family, member 2 | 300 | 0.668 | 0.3891 | Yes |
| 3 | TP53INP1 | TP53INP1 Entrez, Source | tumor protein p53 inducible nuclear protein 1 | 855 | 0.437 | 0.4760 | Yes |
| 4 | TOB1 | TOB1 Entrez, Source | transducer of ERBB2, 1 | 1166 | 0.363 | 0.5566 | Yes |
| 5 | CD53 | CD53 Entrez, Source | CD53 molecule | 1203 | 0.353 | 0.6496 | Yes |
| 6 | MDM2 | MDM2 Entrez, Source | Mdm2, transformed 3T3 cell double minute 2, p53 binding protein (mouse) | 2982 | 0.159 | 0.5942 | Yes |
| 7 | TMEM185A | 3009 | 0.158 | 0.6352 | Yes | ||
| 8 | MALAT1 | MALAT1 Entrez, Source | metastasis associated lung adenocarcinoma transcript 1 (non-coding RNA) | 3178 | 0.148 | 0.6656 | Yes |
| 9 | PMM1 | PMM1 Entrez, Source | phosphomannomutase 1 | 3765 | 0.119 | 0.6651 | Yes |
| 10 | DHRS3 | DHRS3 Entrez, Source | dehydrogenase/reductase (SDR family) member 3 | 4482 | 0.093 | 0.6506 | Yes |
| 11 | EI24 | EI24 Entrez, Source | etoposide induced 2.4 mRNA | 4605 | 0.089 | 0.6679 | Yes |
| 12 | CCNG1 | CCNG1 Entrez, Source | cyclin G1 | 4643 | 0.088 | 0.6895 | Yes |
| 13 | ISOC1 | ISOC1 Entrez, Source | isochorismatase domain containing 1 | 6483 | 0.046 | 0.6002 | No |
| 14 | YPEL3 | YPEL3 Entrez, Source | yippee-like 3 (Drosophila) | 6608 | 0.044 | 0.6052 | No |
| 15 | ABLIM1 | ABLIM1 Entrez, Source | actin binding LIM protein 1 | 6812 | 0.040 | 0.6048 | No |
| 16 | VMP1 | 8304 | 0.017 | 0.5270 | No | ||
| 17 | TXNIP | TXNIP Entrez, Source | thioredoxin interacting protein | 9605 | -0.001 | 0.4554 | No |
| 18 | LPIN1 | LPIN1 Entrez, Source | lipin 1 | 10231 | -0.011 | 0.4239 | No |
| 19 | ASNSD1 | ASNSD1 Entrez, Source | asparagine synthetase domain containing 1 | 11899 | -0.042 | 0.3429 | No |