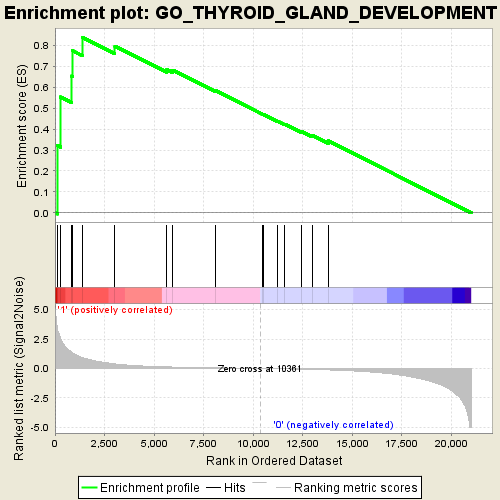
Profile of the Running ES Score & Positions of GeneSet Members on the Rank Ordered List
| Dataset | NS50832_collapsed_to_symbols.NS50832.cls #558AP2_versus_S78.NS50832.cls #558AP2_versus_S78_repos |
| Phenotype | NS50832.cls#558AP2_versus_S78_repos |
| Upregulated in class | 1 |
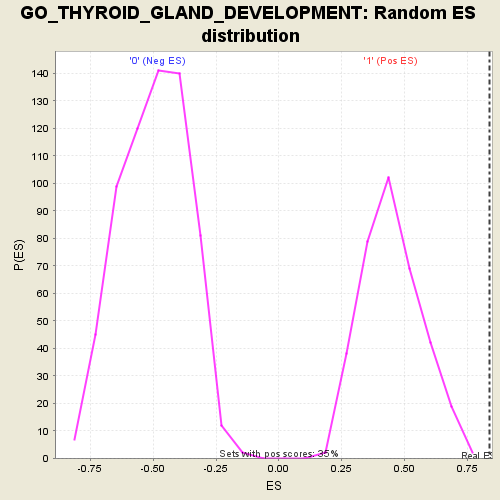
| GeneSet | GO_THYROID_GLAND_DEVELOPMENT |
| Enrichment Score (ES) | 0.83750683 |
| Normalized Enrichment Score (NES) | 1.8659519 |
| Nominal p-value | 0.0 |
| FDR q-value | 0.07368098 |
| FWER p-Value | 0.474 |
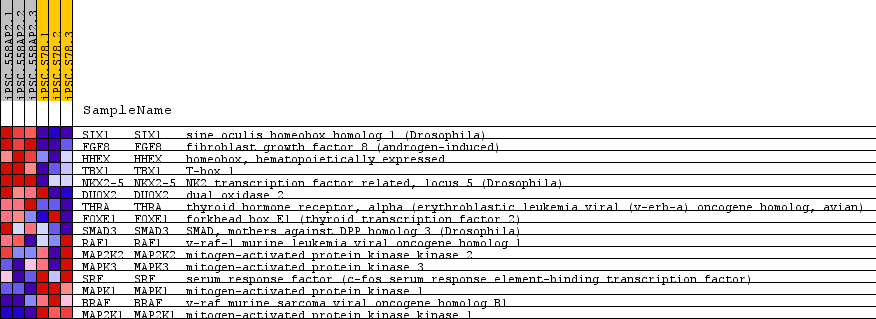
| PROBE | GENE SYMBOL | GENE_TITLE | RANK IN GENE LIST | RANK METRIC SCORE | RUNNING ES | CORE ENRICHMENT | |
|---|---|---|---|---|---|---|---|
| 1 | SIX1 | SIX1 Entrez, Source | sine oculis homeobox homolog 1 (Drosophila) | 113 | 3.493 | 0.3216 | Yes |
| 2 | FGF8 | FGF8 Entrez, Source | fibroblast growth factor 8 (androgen-induced) | 277 | 2.560 | 0.5535 | Yes |
| 3 | HHEX | HHEX Entrez, Source | homeobox, hematopoietically expressed | 846 | 1.359 | 0.6536 | Yes |
| 4 | TBX1 | TBX1 Entrez, Source | T-box 1 | 892 | 1.305 | 0.7735 | Yes |
| 5 | NKX2-5 | NKX2-5 Entrez, Source | NK2 transcription factor related, locus 5 (Drosophila) | 1370 | 0.926 | 0.8375 | Yes |
| 6 | DUOX2 | DUOX2 Entrez, Source | dual oxidase 2 | 3020 | 0.394 | 0.7957 | No |
| 7 | THRA | THRA Entrez, Source | thyroid hormone receptor, alpha (erythroblastic leukemia viral (v-erb-a) oncogene homolog, avian) | 5639 | 0.138 | 0.6839 | No |
| 8 | FOXE1 | FOXE1 Entrez, Source | forkhead box E1 (thyroid transcription factor 2) | 5926 | 0.125 | 0.6819 | No |
| 9 | SMAD3 | SMAD3 Entrez, Source | SMAD, mothers against DPP homolog 3 (Drosophila) | 8112 | 0.055 | 0.5829 | No |
| 10 | RAF1 | RAF1 Entrez, Source | v-raf-1 murine leukemia viral oncogene homolog 1 | 10479 | -0.003 | 0.4704 | No |
| 11 | MAP2K2 | MAP2K2 Entrez, Source | mitogen-activated protein kinase kinase 2 | 10506 | -0.004 | 0.4695 | No |
| 12 | MAPK3 | MAPK3 Entrez, Source | mitogen-activated protein kinase 3 | 11216 | -0.023 | 0.4379 | No |
| 13 | SRF | SRF Entrez, Source | serum response factor (c-fos serum response element-binding transcription factor) | 11583 | -0.034 | 0.4236 | No |
| 14 | MAPK1 | MAPK1 Entrez, Source | mitogen-activated protein kinase 1 | 12419 | -0.061 | 0.3895 | No |
| 15 | BRAF | BRAF Entrez, Source | v-raf murine sarcoma viral oncogene homolog B1 | 12972 | -0.083 | 0.3710 | No |
| 16 | MAP2K1 | MAP2K1 Entrez, Source | mitogen-activated protein kinase kinase 1 | 13780 | -0.120 | 0.3438 | No |