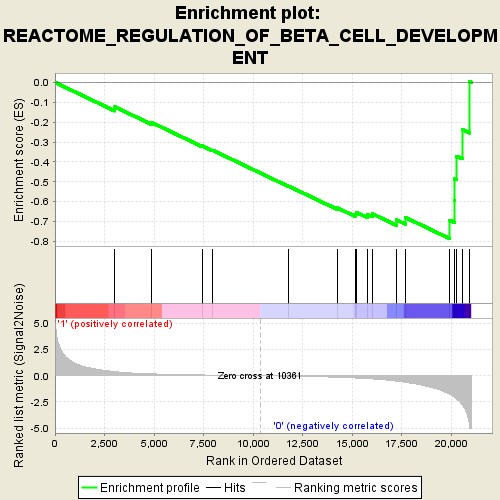
Profile of the Running ES Score & Positions of GeneSet Members on the Rank Ordered List
| Dataset | NS50832_collapsed_to_symbols.NS50832.cls #558AP2_versus_S78.NS50832.cls #558AP2_versus_S78_repos |
| Phenotype | NS50832.cls#558AP2_versus_S78_repos |
| Upregulated in class | 0 |
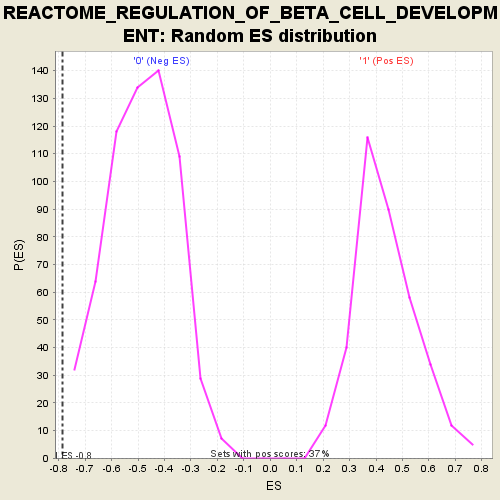
| GeneSet | REACTOME_REGULATION_OF_BETA_CELL_DEVELOPMENT |
| Enrichment Score (ES) | -0.78524 |
| Normalized Enrichment Score (NES) | -1.6197321 |
| Nominal p-value | 0.0 |
| FDR q-value | 0.8434926 |
| FWER p-Value | 1.0 |
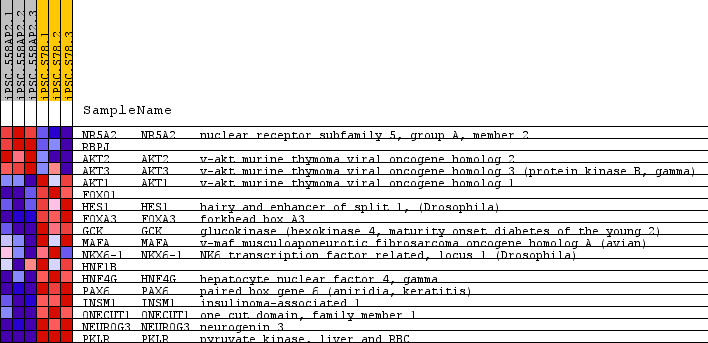
| PROBE | GENE SYMBOL | GENE_TITLE | RANK IN GENE LIST | RANK METRIC SCORE | RUNNING ES | CORE ENRICHMENT | |
|---|---|---|---|---|---|---|---|
| 1 | NR5A2 | NR5A2 Entrez, Source | nuclear receptor subfamily 5, group A, member 2 | 3014 | 0.395 | -0.1227 | No |
| 2 | RBPJ | 4868 | 0.180 | -0.2014 | No | ||
| 3 | AKT2 | AKT2 Entrez, Source | v-akt murine thymoma viral oncogene homolog 2 | 7413 | 0.074 | -0.3187 | No |
| 4 | AKT3 | AKT3 Entrez, Source | v-akt murine thymoma viral oncogene homolog 3 (protein kinase B, gamma) | 7953 | 0.060 | -0.3413 | No |
| 5 | AKT1 | AKT1 Entrez, Source | v-akt murine thymoma viral oncogene homolog 1 | 11777 | -0.040 | -0.5214 | No |
| 6 | FOXO1 | 14239 | -0.147 | -0.6309 | No | ||
| 7 | HES1 | HES1 Entrez, Source | hairy and enhancer of split 1, (Drosophila) | 15160 | -0.217 | -0.6632 | No |
| 8 | FOXA3 | FOXA3 Entrez, Source | forkhead box A3 | 15186 | -0.219 | -0.6527 | No |
| 9 | GCK | GCK Entrez, Source | glucokinase (hexokinase 4, maturity onset diabetes of the young 2) | 15755 | -0.277 | -0.6651 | No |
| 10 | MAFA | MAFA Entrez, Source | v-maf musculoaponeurotic fibrosarcoma oncogene homolog A (avian) | 15996 | -0.305 | -0.6602 | No |
| 11 | NKX6-1 | NKX6-1 Entrez, Source | NK6 transcription factor related, locus 1 (Drosophila) | 17225 | -0.516 | -0.6913 | No |
| 12 | HNF1B | 17674 | -0.626 | -0.6793 | No | ||
| 13 | HNF4G | HNF4G Entrez, Source | hepatocyte nuclear factor 4, gamma | 19897 | -1.746 | -0.6922 | Yes |
| 14 | PAX6 | PAX6 Entrez, Source | paired box gene 6 (aniridia, keratitis) | 20139 | -2.043 | -0.5949 | Yes |
| 15 | INSM1 | INSM1 Entrez, Source | insulinoma-associated 1 | 20152 | -2.065 | -0.4854 | Yes |
| 16 | ONECUT1 | ONECUT1 Entrez, Source | one cut domain, family member 1 | 20259 | -2.234 | -0.3715 | Yes |
| 17 | NEUROG3 | NEUROG3 Entrez, Source | neurogenin 3 | 20539 | -2.785 | -0.2364 | Yes |
| 18 | PKLR | PKLR Entrez, Source | pyruvate kinase, liver and RBC | 20920 | -4.841 | 0.0034 | Yes |