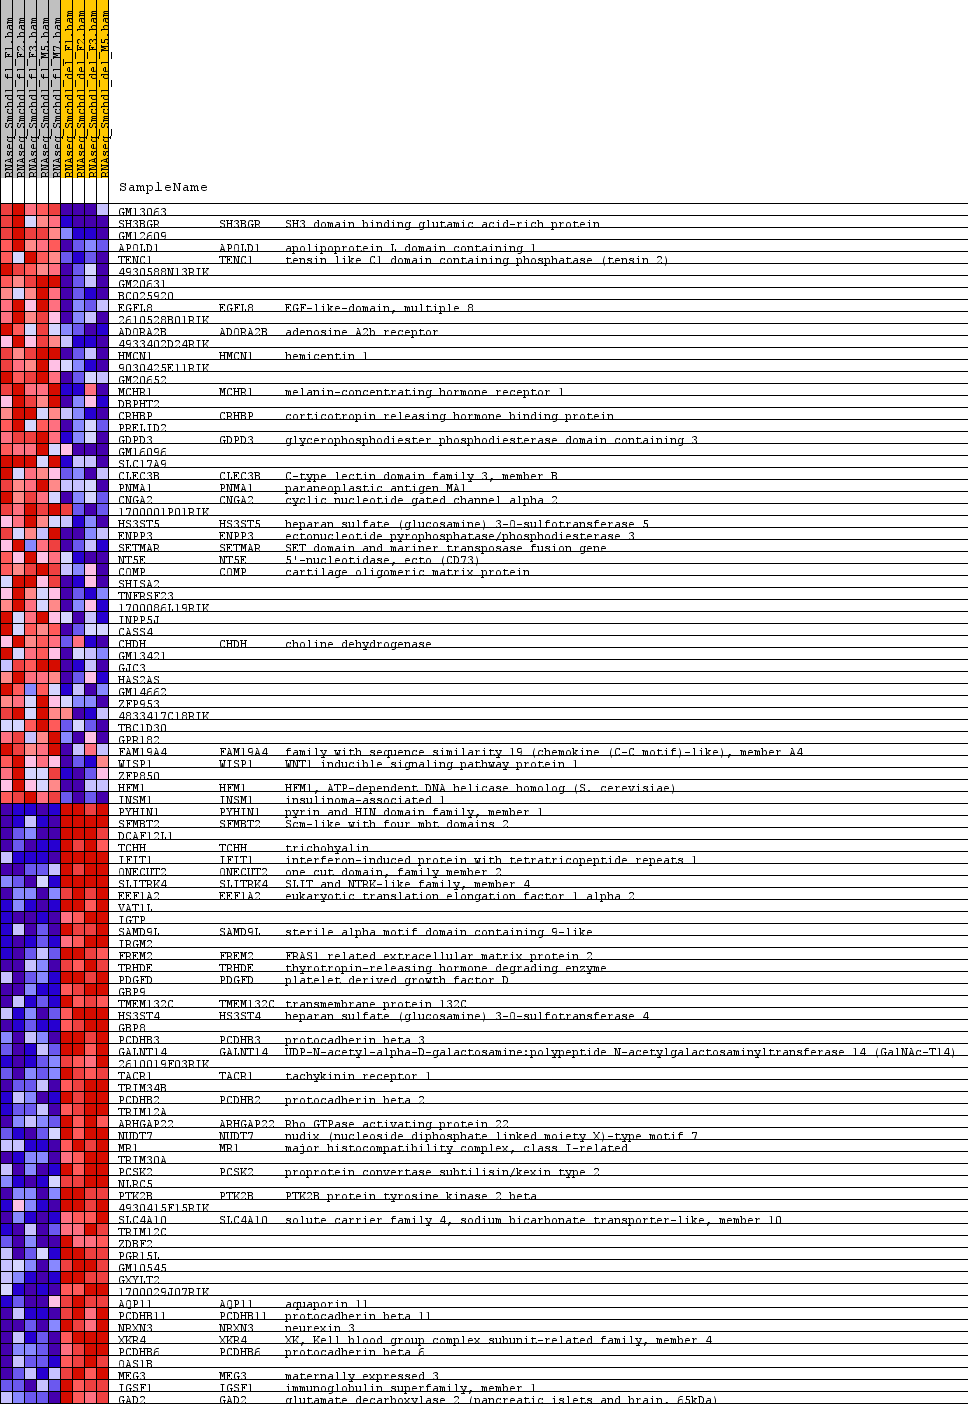
 Fig 1: heat_map
Heat Map of the top 50 features for each phenotype in SMCHD1_KO_collapsed_to_symbols.SMCHD1_KO.cls#del_versus_fl
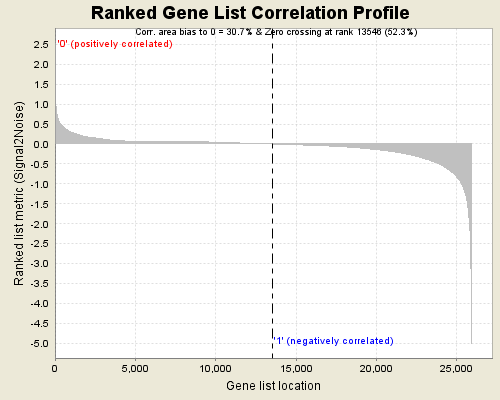 Fig 2: Ranked Gene List Correlation Profile
Ranked list correlations for SMCHD1_KO_collapsed_to_symbols.SMCHD1_KO.cls#del_versus_fl