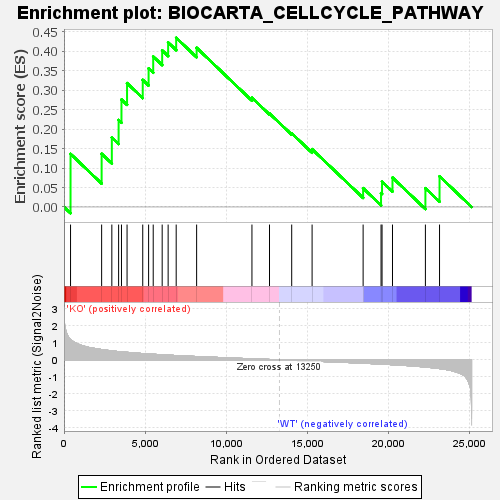
Profile of the Running ES Score & Positions of GeneSet Members on the Rank Ordered List
| Dataset | KO_vs_WT.KO_vs_WT.cls#KO_versus_WT.KO_vs_WT.cls#KO_versus_WT_repos |
| Phenotype | KO_vs_WT.cls#KO_versus_WT_repos |
| Upregulated in class | KO |
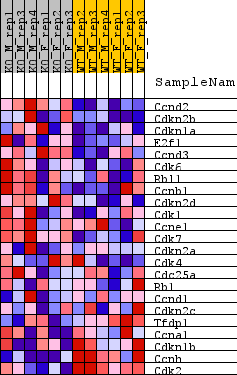
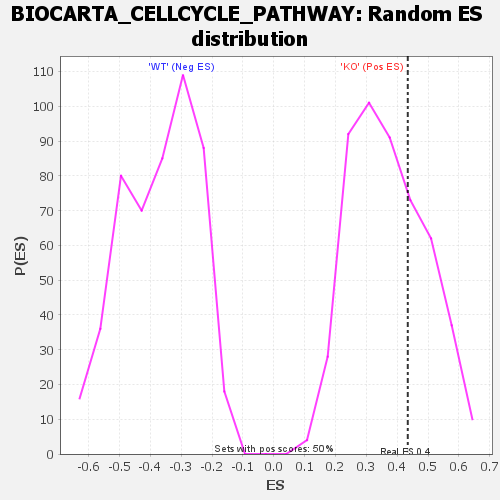
| GeneSet | BIOCARTA_CELLCYCLE_PATHWAY |
| Enrichment Score (ES) | 0.43440422 |
| Normalized Enrichment Score (NES) | 1.1700356 |
| Nominal p-value | 0.3253012 |
| FDR q-value | 0.70055634 |
| FWER p-Value | 0.935 |
| SYMBOL | TITLE | RANK IN GENE LIST | RANK METRIC SCORE | RUNNING ES | CORE ENRICHMENT | |
|---|---|---|---|---|---|---|
| 1 | Ccnd2 | Ccnd2 | 403 | 1.195 | 0.1363 | Yes |
| 2 | Cdkn2b | Cdkn2b | 2318 | 0.601 | 0.1366 | Yes |
| 3 | Cdkn1a | Cdkn1a | 2946 | 0.523 | 0.1783 | Yes |
| 4 | E2f1 | E2f1 | 3364 | 0.483 | 0.2232 | Yes |
| 5 | Ccnd3 | Ccnd3 | 3540 | 0.467 | 0.2758 | Yes |
| 6 | Cdk6 | Cdk6 | 3884 | 0.438 | 0.3180 | Yes |
| 7 | Rbl1 | Rbl1 | 4850 | 0.366 | 0.3262 | Yes |
| 8 | Ccnb1 | Ccnb1 | 5211 | 0.345 | 0.3558 | Yes |
| 9 | Cdkn2d | Cdkn2d | 5495 | 0.327 | 0.3862 | Yes |
| 10 | Cdk1 | Cdk1 | 6047 | 0.296 | 0.4019 | Yes |
| 11 | Ccne1 | Ccne1 | 6414 | 0.275 | 0.4224 | Yes |
| 12 | Cdk7 | Cdk7 | 6910 | 0.249 | 0.4344 | Yes |
| 13 | Cdkn2a | Cdkn2a | 8169 | 0.192 | 0.4087 | No |
| 14 | Cdk4 | Cdk4 | 11576 | 0.059 | 0.2804 | No |
| 15 | Cdc25a | Cdc25a | 12658 | 0.021 | 0.2400 | No |
| 16 | Rb1 | Rb1 | 14025 | -0.028 | 0.1891 | No |
| 17 | Ccnd1 | Ccnd1 | 15281 | -0.073 | 0.1485 | No |
| 18 | Cdkn2c | Cdkn2c | 18424 | -0.197 | 0.0483 | No |
| 19 | Tfdp1 | Tfdp1 | 19528 | -0.245 | 0.0356 | No |
| 20 | Ccna1 | Ccna1 | 19590 | -0.250 | 0.0650 | No |
| 21 | Cdkn1b | Cdkn1b | 20233 | -0.283 | 0.0755 | No |
| 22 | Ccnh | Ccnh | 22260 | -0.419 | 0.0482 | No |
| 23 | Cdk2 | Cdk2 | 23131 | -0.512 | 0.0788 | No |