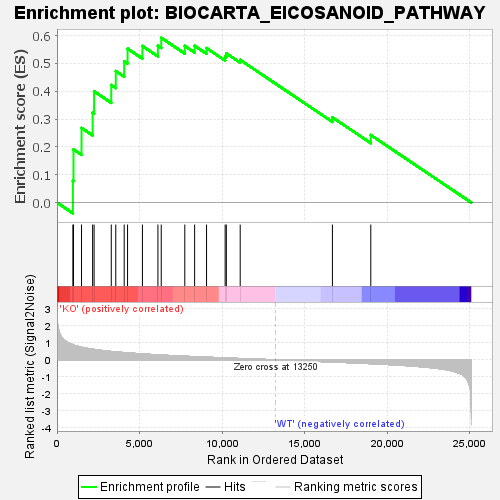
Profile of the Running ES Score & Positions of GeneSet Members on the Rank Ordered List
| Dataset | KO_vs_WT.KO_vs_WT.cls#KO_versus_WT.KO_vs_WT.cls#KO_versus_WT_repos |
| Phenotype | KO_vs_WT.cls#KO_versus_WT_repos |
| Upregulated in class | KO |
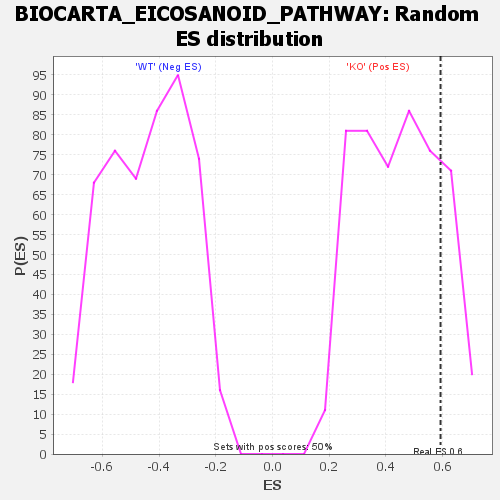
| GeneSet | BIOCARTA_EICOSANOID_PATHWAY |
| Enrichment Score (ES) | 0.592378 |
| Normalized Enrichment Score (NES) | 1.329983 |
| Nominal p-value | 0.18072289 |
| FDR q-value | 0.8629659 |
| FWER p-Value | 0.825 |
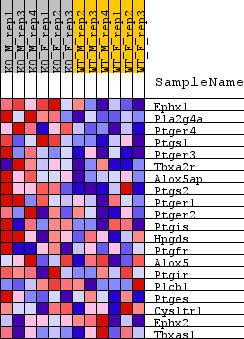
| SYMBOL | TITLE | RANK IN GENE LIST | RANK METRIC SCORE | RUNNING ES | CORE ENRICHMENT | |
|---|---|---|---|---|---|---|
| 1 | Ephx1 | Ephx1 | 962 | 0.887 | 0.0779 | Yes |
| 2 | Pla2g4a | Pla2g4a | 999 | 0.874 | 0.1911 | Yes |
| 3 | Ptger4 | Ptger4 | 1486 | 0.736 | 0.2683 | Yes |
| 4 | Ptgs1 | Ptgs1 | 2159 | 0.624 | 0.3233 | Yes |
| 5 | Ptger3 | Ptger3 | 2248 | 0.611 | 0.3999 | Yes |
| 6 | Tbxa2r | Tbxa2r | 3289 | 0.489 | 0.4226 | Yes |
| 7 | Alox5ap | Alox5ap | 3562 | 0.465 | 0.4727 | Yes |
| 8 | Ptgs2 | Ptgs2 | 4072 | 0.423 | 0.5079 | Yes |
| 9 | Ptger1 | Ptger1 | 4276 | 0.408 | 0.5534 | Yes |
| 10 | Ptger2 | Ptger2 | 5177 | 0.346 | 0.5628 | Yes |
| 11 | Ptgis | Ptgis | 6116 | 0.291 | 0.5636 | Yes |
| 12 | Hpgds | Hpgds | 6317 | 0.280 | 0.5924 | Yes |
| 13 | Ptgfr | Ptgfr | 7745 | 0.210 | 0.5631 | No |
| 14 | Alox5 | Alox5 | 8341 | 0.185 | 0.5636 | No |
| 15 | Ptgir | Ptgir | 9063 | 0.156 | 0.5553 | No |
| 16 | Plcb1 | Plcb1 | 10190 | 0.111 | 0.5250 | No |
| 17 | Ptges | Ptges | 10262 | 0.108 | 0.5363 | No |
| 18 | Cysltr1 | Cysltr1 | 11102 | 0.075 | 0.5128 | No |
| 19 | Ephx2 | Ephx2 | 16691 | -0.124 | 0.3063 | No |
| 20 | Tbxas1 | Tbxas1 | 19017 | -0.222 | 0.2427 | No |