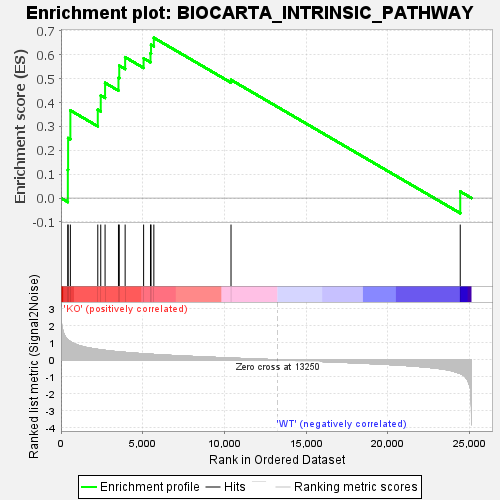
Profile of the Running ES Score & Positions of GeneSet Members on the Rank Ordered List
| Dataset | KO_vs_WT.KO_vs_WT.cls#KO_versus_WT.KO_vs_WT.cls#KO_versus_WT_repos |
| Phenotype | KO_vs_WT.cls#KO_versus_WT_repos |
| Upregulated in class | KO |
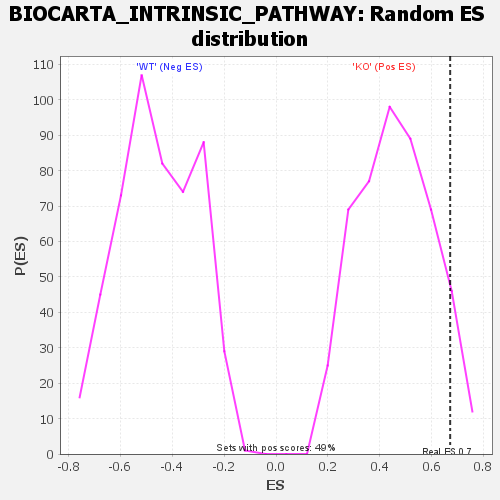
| GeneSet | BIOCARTA_INTRINSIC_PATHWAY |
| Enrichment Score (ES) | 0.67154545 |
| Normalized Enrichment Score (NES) | 1.4653996 |
| Nominal p-value | 0.053608246 |
| FDR q-value | 0.66722715 |
| FWER p-Value | 0.666 |
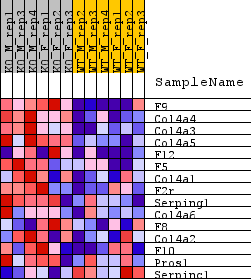
| SYMBOL | TITLE | RANK IN GENE LIST | RANK METRIC SCORE | RUNNING ES | CORE ENRICHMENT | |
|---|---|---|---|---|---|---|
| 1 | F9 | F9 | 418 | 1.184 | 0.1185 | Yes |
| 2 | Col4a4 | Col4a4 | 435 | 1.170 | 0.2515 | Yes |
| 3 | Col4a3 | Col4a3 | 573 | 1.062 | 0.3673 | Yes |
| 4 | Col4a5 | Col4a5 | 2250 | 0.611 | 0.3703 | Yes |
| 5 | F12 | F12 | 2431 | 0.585 | 0.4299 | Yes |
| 6 | F5 | F5 | 2696 | 0.554 | 0.4826 | Yes |
| 7 | Col4a1 | Col4a1 | 3515 | 0.470 | 0.5036 | Yes |
| 8 | F2r | F2r | 3563 | 0.465 | 0.5548 | Yes |
| 9 | Serping1 | Serping1 | 3923 | 0.435 | 0.5902 | Yes |
| 10 | Col4a6 | Col4a6 | 5053 | 0.354 | 0.5856 | Yes |
| 11 | F8 | F8 | 5474 | 0.329 | 0.6064 | Yes |
| 12 | Col4a2 | Col4a2 | 5507 | 0.326 | 0.6423 | Yes |
| 13 | F10 | F10 | 5679 | 0.316 | 0.6715 | Yes |
| 14 | Pros1 | Pros1 | 10399 | 0.102 | 0.4952 | No |
| 15 | Serpinc1 | Serpinc1 | 24420 | -0.796 | 0.0274 | No |