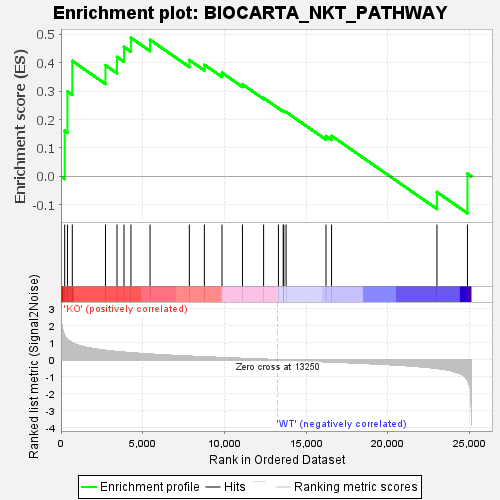
Profile of the Running ES Score & Positions of GeneSet Members on the Rank Ordered List
| Dataset | KO_vs_WT.KO_vs_WT.cls#KO_versus_WT.KO_vs_WT.cls#KO_versus_WT_repos |
| Phenotype | KO_vs_WT.cls#KO_versus_WT_repos |
| Upregulated in class | KO |
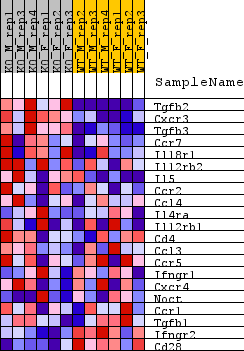
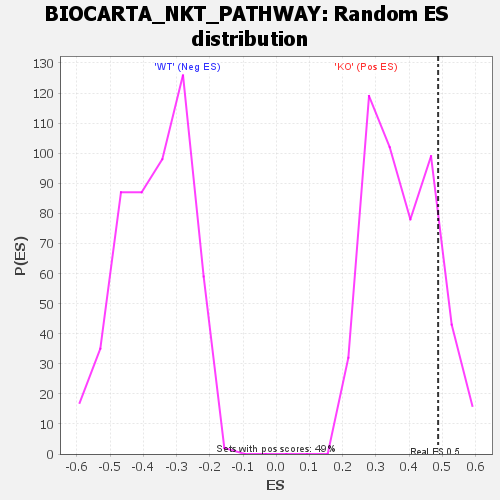
| GeneSet | BIOCARTA_NKT_PATHWAY |
| Enrichment Score (ES) | 0.48711053 |
| Normalized Enrichment Score (NES) | 1.2928455 |
| Nominal p-value | 0.13087934 |
| FDR q-value | 0.7416636 |
| FWER p-Value | 0.853 |
| SYMBOL | TITLE | RANK IN GENE LIST | RANK METRIC SCORE | RUNNING ES | CORE ENRICHMENT | |
|---|---|---|---|---|---|---|
| 1 | Tgfb2 | Tgfb2 | 225 | 1.418 | 0.1605 | Yes |
| 2 | Cxcr3 | Cxcr3 | 394 | 1.211 | 0.2985 | Yes |
| 3 | Tgfb3 | Tgfb3 | 691 | 0.995 | 0.4056 | Yes |
| 4 | Ccr7 | Ccr7 | 2721 | 0.550 | 0.3905 | Yes |
| 5 | Il18r1 | Il18r1 | 3426 | 0.478 | 0.4196 | Yes |
| 6 | Il12rb2 | Il12rb2 | 3853 | 0.440 | 0.4553 | Yes |
| 7 | Il5 | Il5 | 4278 | 0.408 | 0.4871 | Yes |
| 8 | Ccr2 | Ccr2 | 5446 | 0.331 | 0.4801 | No |
| 9 | Ccl4 | Ccl4 | 7849 | 0.206 | 0.4090 | No |
| 10 | Il4ra | Il4ra | 8770 | 0.167 | 0.3923 | No |
| 11 | Il12rb1 | Il12rb1 | 9848 | 0.125 | 0.3643 | No |
| 12 | Cd4 | Cd4 | 11100 | 0.075 | 0.3234 | No |
| 13 | Ccl3 | Ccl3 | 12392 | 0.030 | 0.2755 | No |
| 14 | Ccr5 | Ccr5 | 13299 | -0.002 | 0.2396 | No |
| 15 | Ifngr1 | Ifngr1 | 13590 | -0.012 | 0.2295 | No |
| 16 | Cxcr4 | Cxcr4 | 13631 | -0.014 | 0.2296 | No |
| 17 | Noct | Noct | 13767 | -0.018 | 0.2264 | No |
| 18 | Ccr1 | Ccr1 | 16209 | -0.107 | 0.1418 | No |
| 19 | Tgfb1 | Tgfb1 | 16549 | -0.120 | 0.1426 | No |
| 20 | Ifngr2 | Ifngr2 | 22994 | -0.496 | -0.0550 | No |
| 21 | Cd28 | Cd28 | 24860 | -1.165 | 0.0098 | No |