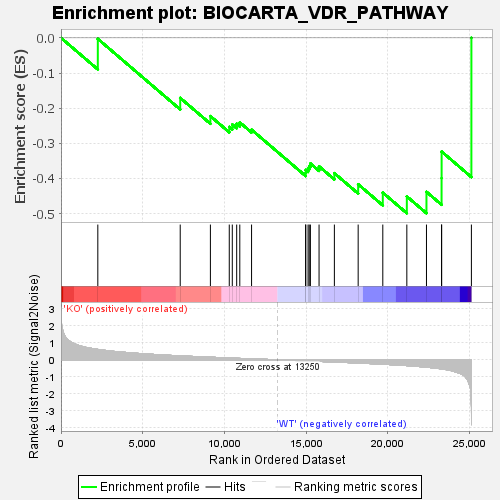
Profile of the Running ES Score & Positions of GeneSet Members on the Rank Ordered List
| Dataset | KO_vs_WT.KO_vs_WT.cls#KO_versus_WT.KO_vs_WT.cls#KO_versus_WT_repos |
| Phenotype | KO_vs_WT.cls#KO_versus_WT_repos |
| Upregulated in class | WT |
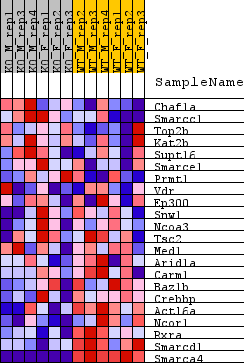
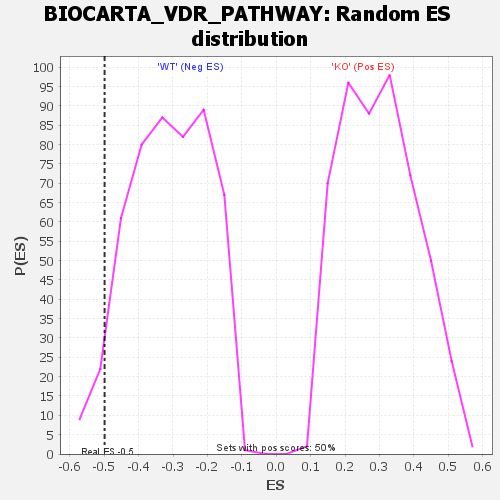
| GeneSet | BIOCARTA_VDR_PATHWAY |
| Enrichment Score (ES) | -0.49884424 |
| Normalized Enrichment Score (NES) | -1.5995165 |
| Nominal p-value | 0.030120483 |
| FDR q-value | 1.0 |
| FWER p-Value | 0.467 |
| SYMBOL | TITLE | RANK IN GENE LIST | RANK METRIC SCORE | RUNNING ES | CORE ENRICHMENT | |
|---|---|---|---|---|---|---|
| 1 | Chaf1a | Chaf1a | 2252 | 0.611 | -0.0029 | No |
| 2 | Smarcc1 | Smarcc1 | 7292 | 0.231 | -0.1709 | No |
| 3 | Top2b | Top2b | 9138 | 0.153 | -0.2227 | No |
| 4 | Kat2b | Kat2b | 10292 | 0.107 | -0.2534 | No |
| 5 | Supt16 | Supt16 | 10477 | 0.100 | -0.2466 | No |
| 6 | Smarce1 | Smarce1 | 10746 | 0.089 | -0.2446 | No |
| 7 | Prmt1 | Prmt1 | 10936 | 0.082 | -0.2405 | No |
| 8 | Vdr | Vdr | 11656 | 0.055 | -0.2613 | No |
| 9 | Ep300 | Ep300 | 14962 | -0.062 | -0.3843 | No |
| 10 | Snw1 | Snw1 | 14971 | -0.062 | -0.3758 | No |
| 11 | Ncoa3 | Ncoa3 | 15112 | -0.067 | -0.3719 | No |
| 12 | Tsc2 | Tsc2 | 15183 | -0.070 | -0.3648 | No |
| 13 | Med1 | Med1 | 15255 | -0.072 | -0.3573 | No |
| 14 | Arid1a | Arid1a | 15784 | -0.091 | -0.3655 | No |
| 15 | Carm1 | Carm1 | 16721 | -0.125 | -0.3850 | No |
| 16 | Baz1b | Baz1b | 18176 | -0.186 | -0.4165 | No |
| 17 | Crebbp | Crebbp | 19683 | -0.255 | -0.4403 | No |
| 18 | Actl6a | Actl6a | 21153 | -0.336 | -0.4510 | Yes |
| 19 | Ncor1 | Ncor1 | 22354 | -0.428 | -0.4380 | Yes |
| 20 | Rxra | Rxra | 23278 | -0.532 | -0.3991 | Yes |
| 21 | Smarcd1 | Smarcd1 | 23281 | -0.532 | -0.3235 | Yes |
| 22 | Smarca4 | Smarca4 | 25102 | -2.785 | 0.0002 | Yes |