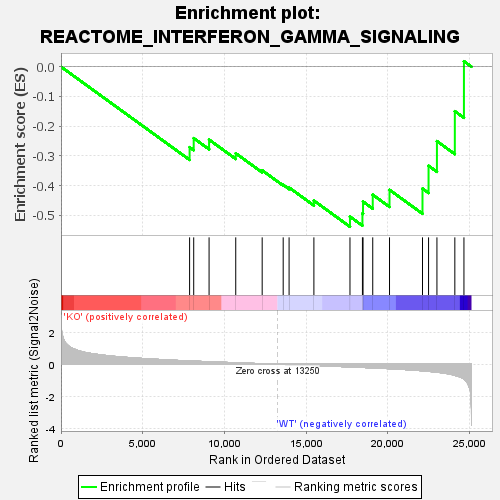
Profile of the Running ES Score & Positions of GeneSet Members on the Rank Ordered List
| Dataset | KO_vs_WT.KO_vs_WT.cls#KO_versus_WT.KO_vs_WT.cls#KO_versus_WT_repos |
| Phenotype | KO_vs_WT.cls#KO_versus_WT_repos |
| Upregulated in class | WT |
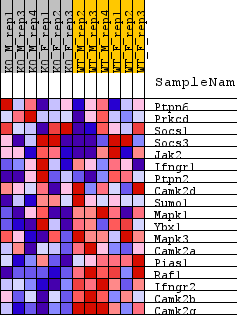
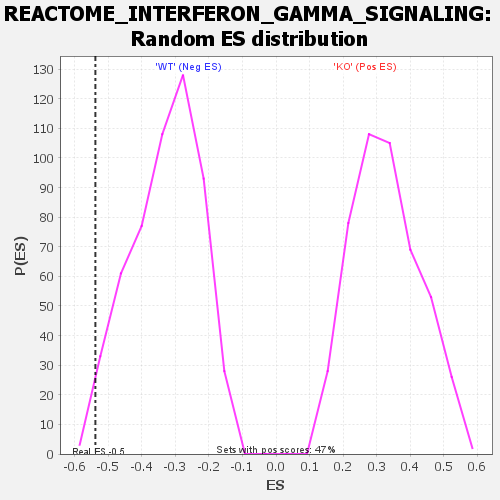
| GeneSet | REACTOME_INTERFERON_GAMMA_SIGNALING |
| Enrichment Score (ES) | -0.5385016 |
| Normalized Enrichment Score (NES) | -1.642755 |
| Nominal p-value | 0.02636535 |
| FDR q-value | 0.7159248 |
| FWER p-Value | 0.905 |
| SYMBOL | TITLE | RANK IN GENE LIST | RANK METRIC SCORE | RUNNING ES | CORE ENRICHMENT | |
|---|---|---|---|---|---|---|
| 1 | Ptpn6 | Ptpn6 | 7866 | 0.205 | -0.2709 | No |
| 2 | Prkcd | Prkcd | 8117 | 0.194 | -0.2405 | No |
| 3 | Socs1 | Socs1 | 9057 | 0.156 | -0.2455 | No |
| 4 | Socs3 | Socs3 | 10688 | 0.092 | -0.2914 | No |
| 5 | Jak2 | Jak2 | 12305 | 0.033 | -0.3488 | No |
| 6 | Ifngr1 | Ifngr1 | 13590 | -0.012 | -0.3975 | No |
| 7 | Ptpn2 | Ptpn2 | 13951 | -0.025 | -0.4066 | No |
| 8 | Camk2d | Camk2d | 15468 | -0.079 | -0.4506 | No |
| 9 | Sumo1 | Sumo1 | 17675 | -0.163 | -0.5045 | Yes |
| 10 | Mapk1 | Mapk1 | 18437 | -0.197 | -0.4938 | Yes |
| 11 | Ybx1 | Ybx1 | 18474 | -0.199 | -0.4539 | Yes |
| 12 | Mapk3 | Mapk3 | 19068 | -0.224 | -0.4309 | Yes |
| 13 | Camk2a | Camk2a | 20094 | -0.276 | -0.4144 | Yes |
| 14 | Pias1 | Pias1 | 22111 | -0.407 | -0.4101 | Yes |
| 15 | Raf1 | Raf1 | 22482 | -0.440 | -0.3334 | Yes |
| 16 | Ifngr2 | Ifngr2 | 22994 | -0.496 | -0.2505 | Yes |
| 17 | Camk2b | Camk2b | 24089 | -0.694 | -0.1498 | Yes |
| 18 | Camk2g | Camk2g | 24646 | -0.915 | 0.0184 | Yes |